Fix It ‘Til It’s Broken
How Federal Reserve Tinkering has set the stage for the largest market and financial collapse in history (and how you can protect yourself and profit from the inevitable).
I am writing this urgent post because I believe we are on the verge of an historic change in the market and economy. It is imperative, if you want to preserve your wealth and even add to it, to understand exactly why this is true. Obviously, most will be skeptical that anything could derail such a powerful bull market such as we are witnessing now. But, as I intend to demonstrate, those conclusions are faulty and nothing is happening now that has not happened in past times, with outcomes very similar to what I am forecasting. First, a little background about why I am posting this information and why you may wish to take my warning seriously.
My name is Jim Shepherd, and for many years I successfully operated financial businesses, including fund management, investment advisory, and investment newsletter publishing. My first major success in the markets came in 1987, the year of the largest stock market crash in history. In the early part of that decade, I had been developing an investment model to forecast major changes in the markets. I had back-tested this econometric model to the 1800s and had been amazed at its accuracy in predicting major market changes. In September 1987, while employed at a commodity brokerage firm as a broker, my model signaled that a major collapse in stocks was imminent. I put together a pool with another broker, and we positioned ourselves with put options on the S&P 500 index. On October 19th, 1987, we were spectacularly rewarded. The historic almost 23% crash on that day transformed our relatively modest investments for ourselves and our investors into millions of dollars. One of our investors in the pool, for example, invested $10,000 and walked away with over $1 million after we deducted our 25% incentive fee. To say that I was pleased with the model’s accuracy would be a massive understatement. I will, when time permits, post all the evidence of this outcome in additional posts.
Obviously, the success we achieved using the model got the attention of many, including local media in San Diego, where I then resided. This led to the launch of my management business and later to advisory activities and an investment newsletter. In the advisory area of my business, as my successes in forecasting the market and economy grew, and clients saw how they could protect themselves and prosper no matter what the economic environment was, I could demand large consulting fees. Many clients, including Hedge Fund managers, Brokerage firms, other advisors and wealthy individuals, paid me as much as $100,000 per year each to advise them. In addition, my newsletter became very popular, with thousands of subscribers all over the world paying me on average $400 per year to obtain my forecasts. I launched my newsletter in 1992 and operated it continuously until I shut it down in 2015, for reasons I will explain later. Below, please observe the results that would have accrued by using the model’s signals from 1982 (I used that year because that was when I started creating the model, but did not use it in real time until 1987) to see what the results were compared to the major indices. As is obvious, the buy-and-hold strategy that has been embraced by the financial community produced anemic results compared to the model. Most importantly, the model’s directives did not result in the major losses and stress that occurred along the way. Please note that the returns depicted below do not include any of the leveraged strategies I used, as in 1987, but would have been obtained by simply investing the amount of capital as stated and following the buy and sell and allocation strategies as indicated by the model.
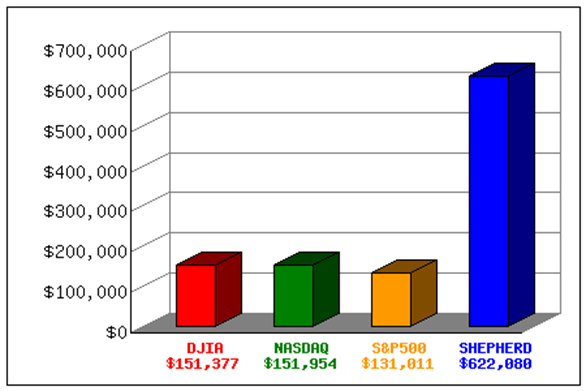
$10,000 invested from August 1982-August 2011
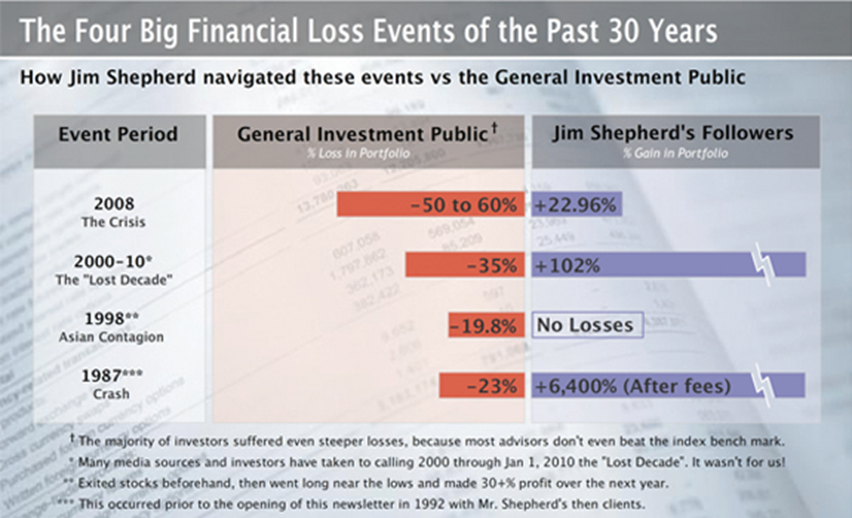
Below, please review the difference between what we achieved compared to the mainstream investment community, noting that even during the most extreme market conditions, we were achieving profits while avoiding massive losses, a main key to prospering over time.
I will be providing examples of what I forecast prior to some of the major events in market history later on, but for now, since my premise is that Federal Reserve interference in the markets has regularly facilitated bubble formation, let’s look at how a bubble typically forms:
How a Financial or Market Bubble Forms
1. Displacement
- A new innovation, policy change, or economic shift sparks investor interest.
- Examples: tech breakthroughs, deregulation, or low interest rates.
2. Boom
- Optimism grows as prices begin rising.
- Media coverage and investor enthusiasm attract more participants.
- Credit becomes more available, fueling further investment.
3. Euphoria
- Prices soar beyond intrinsic value.
- Speculation dominates: investors buy simply because they expect prices to keep rising.
- Warnings are ignored; “this time is different” becomes a common refrain.
4. Profit-Taking
- Savvy investors begin selling to lock in gains.
- Volatility increases, but many still believe the rally will continue.
5. Panic & Collapse
- A trigger (bad news, policy shift, credit tightening) causes a sharp drop.
- Confidence evaporates, leading to mass sell-offs.
- Prices crash, often overshooting to the downside.
Obviously, the main influence the Fed has on markets is the setting of interest rates. I have complained for years that it is unreasonable for such an institution to be expected to successfully navigate all the millions of worldwide factors that control business cycles, trade disturbances, war, etc. Yet, in each case where the Fed has been directly responsible for the formation of a bubble, the bursting thereof occurred because they allowed it to become too large (late in response to overstimulation, for example), or they did not act quickly enough to mitigate the bursting of the bubble, which had become inevitable. Each time a bubble has formed since the Fed has become more actively involved in trying to micromanage the economy (beginning especially after the crash of 1987—more on that topic later), it has taken larger resources to overcome the negative effects of that bursting. This, inevitably has required even larger stimuli to restore confidence and stabilize the economy to the point where it, over time, inflates an even bigger bubble than its predecessor. This progression is obvious to anyone who has studied Fed policy and outcomes, as I have.
Since I don’t wish for this initial post to become too large and thereby be intimidating to read, I will deal with Fed interference and its effects in a separate post. For now, if you review the definition of a bubble above and consider the current environment we are in, it is clear that a huge bubble exists in the stock market, particularly in the Tech sector. Even the mainstream media is starting to posit that overvaluation has reached the point of concern. And so it should be, with the S&P 500 currently sporting a P/E of over 30! This is the highest valuation ever, except for a few times when earnings have collapsed due to an unfolding economic upheaval or other emergency that skewed the ratio. The CAPE P/E has soared to the level it was at just prior to the bursting of the Dot.com bubble in 2000. By the way, my model forecast that event by issuing a sell signal in late 1999. We sidestepped the collapse that followed and made large profits in alternative investments. If you recall, the NASDAQ subsequently lost over 85% of its value before it bottomed!
So, assuming you may agree that there just might be a large and dangerous bubble in place you may ask: Why should we think this cannot go on even longer? What if I exit the market now and miss out on additional profits? Those are reasonable questions. Enthusiasm, bullishness, excitement and greed have taken over the market right now, obviously focused on the AI sector. While it is true that AI will undoubtedly produce many huge and profitable companies (as it already has especially with respect to NVIDIA, for example), that does not mean that overextension can last forever. Remember in the aforementioned tech bubble that started bursting in 2000, many successful and enduring companies were birthed during the Internet boom. However, that did not stop the market from crashing first, before stabilizing after it has wrung out the excesses that were in place. That is why bubbles burst; they can only get so large and then they become unsustainable. That is the place we are at now, I believe. It has been my observation over many decades of research that there are certain signals that emerge just before a major bubble bursts. Below is my definition of what makes a bubble unsustainable and in imminent risk of bursting:
When a market has rallied to new highs and then stabilizes or even declines somewhat but then launches into another dramatic rally that sees the index or investment double over a short period of time, the bursting of that bubble is at hand. Let’s look at some examples of that phenomena.
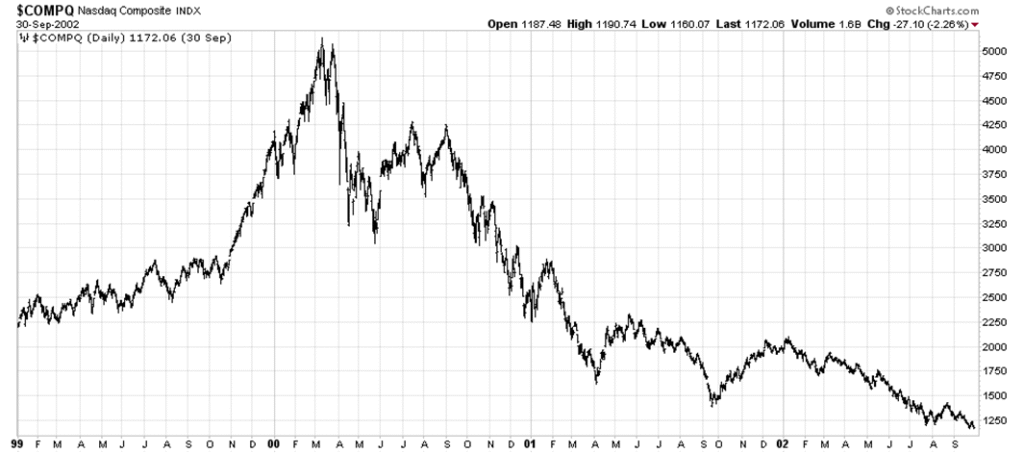
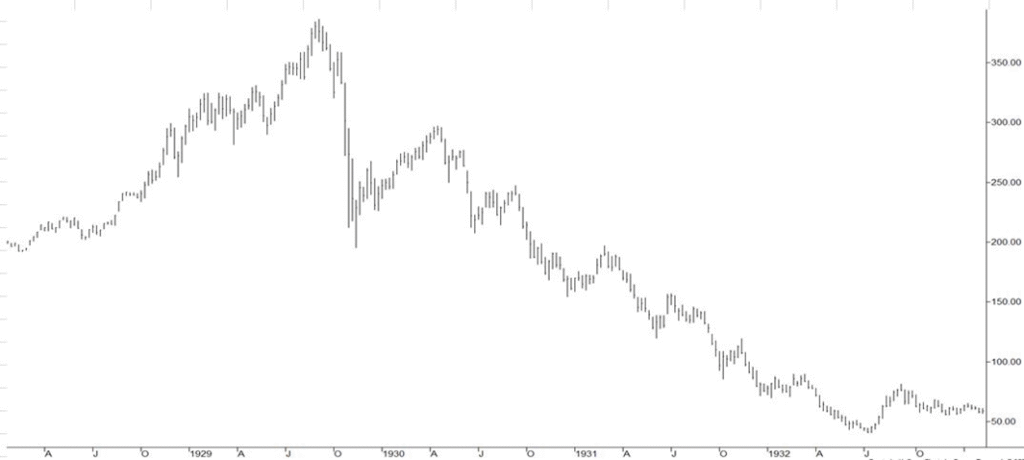
As you can see in the above chart of the NASDAQ, that index doubled from late 1999 until early 2000 and then began a massive decline that ultimately led to a more than 80% collapse. As I said, the model I have used since the early 1980s accurately predicted that event. What about another dramatic example of the same phenomenon we are examining? Observe below the most famous of all stock market crashes, that of the one beginning in 1929. As you can see, the same dynamics existed as the DJIA doubled over a short period of time and then ultimately lost nearly 90% of its value.
So, where are we now? Do the same factors appear to be playing out in the current market environment? The answer to that question appears very clearly in the chart below of the NASDAQ 100 index. As you know, this index is heavily weighted with big tech companies, including AI firms.
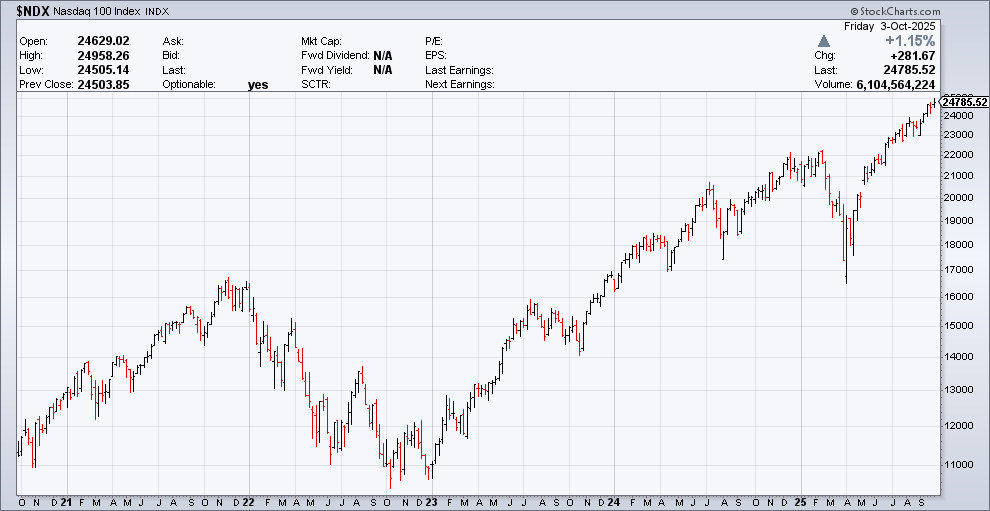
As you can see above, the NASDAQ 100 index has also doubled in a short period of time. This is a red flag that it is grossly overextended and in danger of a large collapse. While this could persist a little longer, I definitely would not recommend waiting to get out. The risk/reward ratio is just too out of whack at present. While I will be awaiting final confirmation from my model before declaring a crash is at hand, the evidence is compelling that we are on the verge of something dramatic.
While I am not in the investment business at present, I feel compelled to issue this warning to perhaps help some of those out there who are being influenced by herd mentality and are not thinking clearly when it comes to plain evidence of substantial risk of loss. I will be putting up other posts regularly, which will deal with the background causes of the effects we are about to witness. Take care and all the best.
Disclaimer: The information provided is for educational purposes only and should not be construed as investment advice. Financial markets involve risk, and past performance is not indicative of future results. Readers should consult a qualified financial professional before making any investment decisions.
