
Tech Bubble Burst 2000 — How the Model Exited Before the Collapse
The following are several newsletters published during the period preceding and immediately after the Tech Bubble Burst of 2000, which I am including here to demonstrate how the model predicted the outcome and allowed my clients to profit from this event.
JAS, Inc. Market Advisory Service October 29, 1999
Thanks, Yogi
You Are Right Again!
With the baseball season having ended this week, I was reminded of two sayings attributed to that great baseball player/philosopher, Yogi Berra. Specifically, the sayings are, “It’s just like Déjà vu all over again,” and, “it ain’t over ‘til it’s over.” Both have special meaning to me. Let me explain.
As you know, I reported that the model has issued a sell signal effective October 25, 1999. We immediately disseminated that information to you and advised that you exit all stock related positions and take positions in bonds, moderate short positions, and very limited protective leveraged positions. What happened next? Well, as you know, after an initial downturn the next day, the market has recovered sharply and I know some of you have doubts with respect to the likelihood of a stock market crash. I remember an almost identical scenario back in 1987. On September 8, 1987, the model generated a sell signal. We began buying put positions to profit from the anticipated decline. But what do you suppose happened? That’s right, the market went against us, rallying about 5%. It appeared to most at that time that the market was headed onward and upward to new record highs. The rally was so unnerving to anyone short the market that even my partner at that time came to me and said he and his wife were considering buying call options (to profit from the rise in the market that he expected to continue) to protect themselves. He was new to the markets and so I fully understood his feelings. I advised him to forget about the day-to-day fluctuations and concentrate on the longer term. I reminded him that the model had never generated a false sell signal in almost 100 years of market data and that I was confident the sell signal would prove to be valid. The rest is history. When the market crashed on October 19, he was a millionaire.
Let me give you another more recent example of the same thing. Remember back in the fall of 1998, when it seemed to most that the world was sinking into a financial black hole. (We had issued a caution in July and avoided the pain of the decline) But just when things seemed the gloomiest, the model issued a buy signal effective September 25. However, after the buy signal the market initially went down about 5%. After that initial move, though, the market rocketed upward 40%. But before it did, let me assure you that I caught some flak. Do things feel the same way to me now? Yes, it’s just like Déjà vu all over again!
Next, let me address the other saying Yogi made famous. Really, it is imperative that you ignore the very short-term fluctuations in the market. On that point, I fully agree with the fund managers, promoters and analysts who have been touting the “focus on the long term” concept. We must learn to disregard the day-to-day activity in the market because it is so unpredictable. For example, it took only one number this week (the employment cost index) to completely change the outlook for the market according to most. Suddenly, all those analysts that had been cautious changed their tune and jumped on the bullish bandwagon again. Yet have things really gotten positive again just because of one data series? Of course not! Furthermore, to trade based on news items will prove to be disastrous. No, we must look to what the underlying reality is with respect to the market. We must ignore the daily activity and direct our attention to a method that has proven itself over many years. Although I obviously cannot guarantee that the market will always respond as it has in the past to a signal in the model, I can assure you that is what we should expect. We cannot discount nearly one hundred years of history. I firmly believe that the market will have a significant downturn before it can move mush higher. And as for the short term well “it’s (the market’s outcome) not over ‘til it’s over.” I expect that we will be right soon, but remember that making money in the market is not quite as easy as it is portrayed these days. It takes determination, focus, and above all the courage to take the opposite point of view from almost everyone else. That is the secret to making real money in the market. Just have a little patience and I am confident we will all be celebrating together.
Now with respect to our current situation, let me give you some thoughts on how I see things unfolding. First of all, let me emphatically state that this recent rally, from the perspective of what we hope to be able to do in the market, is very beneficial. It is not a negative for us regarding any leveraged positions we are hoping to buy. As you know, the extreme volatility we have experienced over the last many weeks has driven options’ prices to unbelievable levels. Except for only a very few positions put on to protect against the unlikely but still possible eventuality of an immediate crash, I could not recommend any such positions. So the rally (and hopefully the calming down of volatility over the very short term) will turn out to be our friend. We want to be able to utilize options, if they fit into our investment posture, but we cannot pay exorbitant prices for them. They are simply too risky to overpay. No, ideally, unless the market crashed immediately, we will be able to position ourselves further out in time for much more reasonable prices. And as for those of you who have only the goal of getting out of the market in advance of a market decline, then our strategy of shifting into long-term U.S. bonds has already proven to be profitable. Furthermore, as the stock market really starts to melt down, bonds will do even better as interest rates collapse. And above all, they are extremely safe.
So, no matter how things currently feel, remember that none of this comes as a surprise to me. In fact, the usual lag time from when we get a signal to when the market actually reacts is on average 3 to 5 weeks. So I did not expect an immediate reaction. However, with the nature of this current market, we have to be much more careful of that possibility. That is why, even if the market goes up slightly higher, I will not regret being out. After all, the last few percentage points of gain will seem mighty small when a decline wipes out 40% or more of the market’s value. I will keep you posted. Take care.
The above issue of my newsletter at that time was published, as you can see, October 29,1999. As is clear, the model I have used since the 1980s correctly predicted at that time what was to come in the near future, namely a horrendous stock market decline that really took hold in 2000 and didn’t end for more than two years. That is why I am so determined to alert investors to the same risks that are in the market currently, and how they can protect themselves. I will include below, other issues from that same timeframe that emphasize how well the model predicted the outcome that occurred.
JAS, Inc. Market Timing Service November 26, 1999
HAPPY THANKSGIVING
The Turkeys Are Everywhere!
By the time you get this, Thanksgiving Day itself will already be over. But since most of you will still be enjoying Thanksgiving weekend, let me take this opportunity to wish all of you and yours the very best of the season. I believe we will all have even more to be thankful for very soon. So now, on to business.
Let me start by reiterating our current position. As you know, effective October 25, 1999, the model generated a sell signal with respect to the U.S. stock market. Now despite what has happened over the intervening weeks, I am absolutely convinced that the next major move will be down. As I have said repeatedly, at a time like this, when I believe we are in a transition from a bull market to a bear market, it is absolutely critical that we do not take foolish risks with our capital. Let me assure you, even though the market has gone up some since the signal, it is always wise to act promptly when the model issues a signal. True, we may not capture the absolute last penny of profit, but we will have our capital intact so that we can be in a position to participate in the next signal that is generated, and the subsequent major move. Furthermore, as volatile as this market is, once the selling starts there will be precious little time to react with respect to exiting one’s stock holdings. I assure you, it will be gut wrenching, once the selling starts in earnest, and even the most experienced investors will have difficulty deciding what to do. If the market initially drops 15%, for example, most modern investors will chant the old “don’t worry, it will come back,” mantra. Then, when the market drops more and more and they start to doubt themselves, the real panic will set in. Wave after wave of selling will cut to pieces even the most carefully laid out strategies. How do I know this? Because, despite the current media hype, the world is still essentially the same with respect to the markets and investments. You see, as I have often pointed out, human nature dictates the action in all markets and human nature never really changes. Therefore, at certain critical turning points we can expect to see substantially the same reactions as always. Those major turning points have been what the model has always measured so accurately. Let me say, though, that our goal doesn’t have to be predicting the exact top or bottom, particularly in a situation like we are in now. That isn’t necessary and probably is impossible to achieve (although many times the model has been nearly perfect). Although I do use, usually with excellent accuracy, shorter-term technical and historical analysis, when we anticipate the onslaught of a bear market, like now, we must take immediate action. And yes, the market can temporarily go against us. The reason is, manias can last a little longer than expected and so can periods of gloom. But the important point is to be out of the market prior to a major move down, when there is so much risk that hanging on is foolhardy. That is the course I have recommended and I am confident it will prove to be the correct course. After all, we have just reached the beginning of the normal earliest reaction time from when the model generates a signal to when the market reacts. The normal lag time is from 3 to 5 weeks. In 1929, the signal came nearly two months before the crash and in 1987 six weeks prior to that crash. So just because three weeks have gone by, I am not the least bit concerned. So, you may ask, why did I recommend exiting the market if there is a normal lag time? Well, obviously, I wish I could have been certain that the market would initially rally after the signal. But I must be consistent and I do not regret, with a market as dangerous and volatile as this one is, recommending getting out when I did. That was the prudent thing to do and I expect that over the long run it will prove to be the best course of action. But what, you may ask, makes me believe so strongly that the market will really collapse? Of course, I have the model to rely on. But I am aware that you do not and even though you can look at the record of the model it is still not as comforting as knowing what I know about the current conditions. So I have decided to spend some time here going over some of the supporting reasons for my conviction. Now, obviously, I do not intend to divulge the actual makeup of the model. What I am going to discuss are some of the many effects that are the results of conditions measured by the model. I believe once you examine the arguments I am about to put forth, your confidence in the likelihood of a market meltdown will increase dramatically.
Valuation
Let’s begin by discussing valuations. Everyone knows that stocks, compared to historical guidelines, are vastly overvalued. Multiples have risen to unprecedented levels. (Of course, I am referring to stocks that actually have earnings, whereas many have no earnings whatsoever). But this, in and of itself, does not mean imminent collapse. As we have seen, this overvaluation has been in effect for a long time. It has lasted so long, in fact, that many have declared that it no longer matters. While it is true that this extreme overvaluation can last a long time, it cannot go on indefinitely. Why? Because ultimately stocks must have some intrinsic value. Common sense tells us that if a stock is valued only on the basis of being able to sell it to someone else in the future at a higher price because it continues to have a good story, trouble must be near. In other words, there must be more of a reason to buy a stock than the hope that it will continue to become even more overvalued. There is a point at which the realization that this is an illogical concept will dawn on many investors. That is what happened in Japan in 1989; many of you will remember that their market rose to around 40,000 in December of that year. Although valuations exceeded anything anyone had ever seen before, the story went that 50 times earnings was okay for Japanese stocks because things were ‘different’ there. The average Japanese citizen saved more, invested more, and was more productive and so on and so on. Does that sound familiar? What happened next? Well, the Nikkei plummeted and is still less than half the value it was at its peak. I assure you, all of the current stories that things are different here this time are nonsense. It is only a question of time before that realization hits the average investor like a sledgehammer.
The Environment
You may ask, what has changed in the environment that makes a bear market possible? Inflation is low, productivity is high, unemployment is low, interest rates are fairly low, corporate earnings are good, etc. But are these statements really true? I believe further examination will make it clear that they are not. First of all, let me remind you that the stock market is a forward-looking indicator. It discounts the future and adjusts accordingly. In other words, the stock market forecasts what the future will be 6 to 12 to 18 months in advance, based on what it expects the investment climate to be at that time. If it did not act this way, investing would be so simple. All we would have to do would be to read the morning paper and find out what the current environment was and invest accordingly. Sadly for most, this is not the way things work. So what does the future really look like? Let’s start with inflation. Inflation at the current moment is fairly low. But the main cause of this low inflation is the near economic depression that swept over Asia and elsewhere around a year ago. (It actually began before that and so its effects were apparent for at least two years). The result of all this economic malaise was that we were able to buy goods at ever lower prices. All of our imports were costing us less and less. And even though we continued to run record trade deficits, the effects of a strong dollar vs. other world currencies, and the necessity of those countries to sell their goods to us at ever lower prices, allowed inflation to remain subdued. But I remind you that it takes time for changes in the goods we import to filter into the inflation data. Consequently, the inflation numbers, which are lagging indicators, continue to reflect low inflation. But going forward, with so many changes in the import situation, that will change dramatically. For example, one of our biggest imports, oil, has gone from a low of just over $10.00 a barrel in December of last year, to around $26.00 a barrel now. That is a dramatic increase and will have a substantial impact on us. After all, the cost of every good and service produced in this country is directly or indirectly influenced by oil. As we continue to set record after record with respect to our trade imbalance, inflation will inevitably be a factor. In fact, the way I measure inflation at the wholesale level is by a monthly year-over-year comparison. That way, seasonal factors are already automatically accounted for. As of the October PPI data just released, I measure the annual wholesale inflation rate at 2.8%, and on an up trend. This is a very real warning sign for the stock market. (Let me remind you that I do not yet expect a breakout of inflation to the point where we would be buying inflation hedges; however, it will become enough of a problem to force interest rates higher and affect the stock market).
The employment situation, although good for job seekers, really just contributes to inflationary pressures. There is no doubt that the extreme shortage of workers will translate soon into wage pressures. Heretofore, workers had to be content with modest salary increases (if any) or lose their jobs. Now, they are in the driver’s seat and no doubt will begin to put pressure on the cost of doing business with respect to the labor side of the equation.
Let’s look at the interest rate picture. Many have suggested that interest rates are relatively low and falling. I disagree. Relatively speaking, based on how inflation is reported by the general media, long-term interest rates are quite high. The historical differential of long-term interest rates to the rate of inflation is around 3%. Currently, according to the latest CPI figures, that spread is much wider and has been for some time. Furthermore, long-term interest rates have been rising until just recently from a low in October of 1998 of 4.72% to the recent high yield of 6.40% on October 25 (that is the day we issued our sell signal for stocks and a buy signal for 30 year T-Bonds, which have done very well since then). Now, I am well aware that the reason interest rates dropped so low in the fall of 1998 was because of the problems in Asia and the bailout of the region. Nevertheless, those low interest rates allowed us to dodge a bullet and let the bull market run a little longer. If you recall, we issued a ‘caution’ on July 10, 1998, as the model was getting very near a sell signal. Although the sell signal did not come, the market did sell off substantially. As things changed very quickly, we actually received and issued a buy signal (when nearly everyone else was predicting the end of the world) in September of that year that proved to be very profitable indeed. But as for now, interest rates are still very high and at the short end of the yield curve they have still been rising. It is a false assumption that the current interest rate picture is conducive to a continuation of the bull market in stocks. Quite the contrary, in fact. Furthermore, adding short-term pressure to the interest rate picture is the fact that the Philadelphia Electric Utility Index has just broken down to a new two year low. This index, because of its components’ sensitivity to the cost of money, is an excellent forecaster of the direction of interest rates. With the index making an important low, it tells me interest rates are going higher over the short term, increasing pressure on the stock market. (Remember though, when the stock market really starts to collapse, bonds will do very well and that is why I am in them).
Finally, let’s examine corporate earnings. Are they really as good as they look at first glance? No, because they are being compared to year-ago results that were rather dismal as the Asian crisis was unfolding. In reality, with a few exceptions, earnings are not very impressive when compared to the normal trend. Of course, the current game is to make sure earnings match analysts’ estimates. That way, no matter how lackluster the earnings really are (notwithstanding the fact they are being compared to weak earnings a year ago) the stock is bid higher because it ‘beat the street.’ What a dangerous and foolish game to play!
The Fed
There has recently developed a cottage industry that engages in trying to forecast what the Fed will do next. Every time a FOMC meeting approaches, every bit of data is analyzed and compared in an attempt to deduce what they will do. When the decision is imminent, virtually all reporting focuses on this release. But I ask you, is it that important to try to guess what their next move will be? Well, except for normal short-term reactions immediately after the release, I might surprise you by saying no. In reality, as I will soon demonstrate, what they have already done is more important than what they might do because their action has already caused certain inevitable reactions. I know there are many adages with respect to the Fed that you may be familiar with. One very popular notion is the ‘three steps and a stumble’ indicator. Essentially it states that whenever the Fed raises official rates three consecutive times, the market will fall. However, if you study this you will find that it is not really very accurate at all. True, there have been a few instances where it has worked, but there have been many when it has not. What I am about to tell you now is a Fed indicator that is much more reliable. I discovered it while researching the above ‘rule’ to see if it was trustworthy. What I am about to tell you is not part of the model but I do use it as an early warning. If you were to use just this indicator, even though it is not nearly as accurate timing- wise as the model and even though it has application only to the stock market and does not deal with other investment areas as the model does nor has it caught all the major moves, you would still do better than 90% of the investment professionals out there. (Of course, I cannot completely lay out the strategy here). What is it? Well, it relates to a change in trend of the Discount Rate. Now some have previously postulated, incorrectly, that any reversal of trend was the key. In fact, the trend must first have become established enough so changes made are not merely adjustments due to ongoing monetary requirements. Therefore, the rule is: whenever the trend in the Discount Rate changes (the trend having been identified as per my proprietary work) you can expect a converse move in the stock market within a fairly short period of time. That’s it. It seems simple enough, but believe me it is powerful. Let me give you a few examples. By the way, I went back far enough so that we covered enough time in order to demonstrate that things really do not change that much and that we are not in a ‘new world.’ In 1954, after Discount Rate hikes going back to 1946, the Fed lowered the Discount Rate on February 5. The DJIA had closed out January of that year at 292. By the time the Fed began raising rates again, on April 15, 1955, the Dow was at 425, after making a high of 517. Not a bad increase for a one-year period (46%!) After the market spent much time chopping around, during which you would have been out of the market per the above rise in rates, the Fed moved again to lower rates (against the trend) on November 15, 1957. The result? Well, the DJIA closed out October 1957 at 441 and by the time the Fed raised rates again, September 12, 1958, the Dow was at 557. That is another increase of over 26% in less than a year. Now during 1962, things were turbulent in the market due to the Cuban missile crisis and President Kennedy’s showdown with the steel industry. However, when the signal came to go back into the market due to another Fed Discount Rate cut on June 10, 1960, the Dow stood at 625. Holding until the trend changed again (and saw the Discount Rate at its highest ever), you would have exited at 969 on the Dow in 1965, a gain of 55%. That sell signal would have kept you out of the market until November 13, 1970, with the Dow at 755. When the Fed again cut rates you would have ridden the market all the way until January 1973, with the Dow at 1020, for another gain of 35% (Of course, none of the gains referred to include dividends). Now this era (late 1973) had very much of the same thinking going on as now. Then, as now, “all you needed to do was to buy a few of the right stocks and forget about them. Your future was secure. We were in a new environment, driven by the technology of the time that would insure that everyone could become rich in the stock market.” Had you shorted the market upon the above sell signal, you would have seen the Dow drop from the 1020 level in January 1973, until you received the next buy signal in December 1974, with the Dow at 616. (The Dow then surged higher again, closing at 1002 in December 1976). Next, you would have been out of the market completely as of mid 1977 and stayed out until July of 1982. (During that period, my model would have had you in inflation hedges, which did spectacularly well). With the Dow at 808 as of the close in July 1982, and everyone completely gloomy, the Discount rate signal was again triggered. It would forecast a rise all the way until September 1987, with the Dow at 2663, for a gain of 230%!!! Then, of course, if you would have shorted the market you could have done as well as we did during that time. But even if you just went to cash you would have done well until the next Discount rate buy signal came in December 1990, with everyone paranoid about the Gulf crisis and the Dow sitting at 2633. You would have held until May of 1994, for another gain of 43%. Then, you would have been out of the market until the next buy signal, January of 1996, with the Dow at 5395. You would have remained in that position until, you guessed it, August 24, 1999, with the Dow making its all time high one day later at 11326. Not a bad record, is it? But what is more important, I believe, is that it demonstrates that certain things continue to work, through wars, recessions, assassinations, scandals and upheaval. No, the market is really not that much different than it ever has been. Yes, technology changes the way things are done but not why they are done.
Other Classic Signs of Danger
I realize that some things are just not considered ‘cool’ these days. I mean, after all, what possible application could indicators created a century ago have today. Well, for one, the Dow theory cannot be completely ruled out. It has been a good general indicator of danger for many, many years. What is it telling us? Obviously that the high in the DJIA on August 25 has not been confirmed by a new high in the Transportation Index, a requisite to indicate clear sailing ahead. In fact, the Transportation Index now stands 22% lower than its May 12, 1999 peak. That is a clear warning and should not be ignored.
Next, we have consistently seen the rest of the market, except for a few stocks, not performing very well. Day after day, even when the DJIA has risen substantially and the NASDAQ has skyrocketed, we have seen more stocks declining on the NYSE than advancing and more new lows than highs. This negative breadth, although improved from previous readings, cannot go on much longer. It is telling us that the overall market is weak and is signaling grave danger. Despite what the media says, the reason why the NASDAQ index has done so well is because of a few heavy capitalization stocks that have been the recipient of ‘Johnny come lately’ buying. They have accounted for much of the rise in the index, whereas the Dow has risen much more modestly since the sell signal came. It is important to point out, however, that the Dow has risen just about as much as it did in 1987 before it turned around. Imagine how disappointed I would have been if I would have lost confidence in the model and bailed out of our positions in 1987 just before the crash! Neither should we be too hasty to jump to conclusions now.
There are many other indicators, not necessarily components of my model that are also screaming danger. Of course, you don’t hear much about that these days, which is to be expected. And that brings me to my next point.
Sentiment
I realize that it is very difficult to ignore the drumbeat of the media these days, telling you that you are a fool if you expect the market to ever have a meaningful decline. This, however, is to be expected at major turning points. In fact, if the rhetoric wasn’t so completely one-sided, I would be much more nervous. Remember, there will never be a notice on the floor of the New York Stock Exchange notifying you that the bull market is over and it is now time to exit in an orderly fashion. No, when the end comes, as it will, it will be a surprise to almost everyone. It will be violent and it will be dramatic. How do I know that? Because I have carefully studied every single panic and mania of this century (and even prior to that) and it always works out the same. The reason no one is talking about such an event now, except a few of us, is that the vast majority believes such a thing can no longer happen. They have all the standard reasons: regulatory circuit breakers, stock hungry baby boomers, and so on. None of these things are reasons, however, but merely justifications. Of course the commentators are positive. That’s because their ratings would plummet if they took a bearish stance. Very few of the general public wants to hear that their college funds and retirement funds, etc. are about to be cut in half. No, being bearish is not popular. That is why those that are bullish, even when they are wrong, are let off the hook with hardly a comment. Anyone who is bearish and who has been wrong (as per the plethora of advisors who were prematurely bearish over the last several years) is mocked and ridiculed. (Even I have been recently chastised and I certainly cannot be ‘wrong’ quite this soon, but I do not take it personally—it’s just part of the business). No, it is not popular to be bearish. But I wish to stress that there is a big difference in being bearish and being pessimistic. I am an optimist by nature but a realist by training. I have learned that it is possible to make money in both up and down markets and when my indicators are showing danger, I have no problem taking a bearish stance. Others, who are perennial bears, seem to have a grudge against the market. I do not; my only interest is in letting the model predict when the market will move and in what direction so that my clients and myself can profit.
In closing, let me remind you about that very thing. As I said earlier, the normal lag time from signal to reaction in the market is 3 to 5 weeks. However, we have had times when it was longer, even two months (as in 1929) or more. Since six to eight weeks would put us smack into the holiday season, there is less likelihood, based on seasonality, that the market will crash then. That makes January the next most likely timeframe for the crash to begin. However, since this is a special year due to overhanging fears about Y2K, we have to be very careful about assuming anything and I am carefully monitoring my short-term indicators to watch for any imminent collapse. However, for those of us who plan to use leverage, the rally we have seen has been most beneficial. As you know, I advocated only very minor positions in leveraged instruments when we first got the sell signal because of the extreme prices due to volatility. Now, I am carefully watching for an opportunity to put on much more to benefit from the impending decline, thankfully at much better prices. But my main point is, just because the market did not immediately collapse after the signal, do not assume that it will not collapse. The market is extremely dangerous and those that choose to stay in it will be severely damaged. They are much like Cinderella, who just couldn’t make herself leave the ball in time, until her horse drawn carriage turned back into a pumpkin. That is an appropriate analogy at this time, but we definitely want to be eating pumpkins (pies) now, not riding in them! I will keep you posted. Take care.
Current Position: If you have not done so you should immediately exit your positions in the stock market. If you have not already purchased T-Bonds, you should now wait and stay in short term government securities or cash until further notice, when I advise, via voice mail updates, that the move down in stocks is imminent. Likewise, as I put leveraged positions in place for my managed accounts, I will alert you via the voice mail updates. (As always, since I do not personally know you, I cannot and do not recommend leveraged instruments to you but as promised I will pass the information along to you).
JAS, Inc. Market Timing Service December 23, 1999
(For Us Anyway)
With all the uncertainty and concern surrounding the dawning of the new millennium, I believe that we can takecomfort in the knowledge that 2000 should be a banner year for all of us. Obviously I conclude this because I am confident that we are getting very near the collapse we are expecting in the stock market. That fact will be most important for us, as we will first of all be out of the stock market when this event unfolds. This will preserve and protect our capital to be deployed in the future to buy vastly under priced stocks. Secondly, those of us that intend to use leveraged instruments will be able to profit from the collapse (of course leveraged instruments involve risk and should only be undertaken with risk capital). Yet I am aware that waiting for the market to begin its decline is uncomfortable and difficult for many. I understand these emotions because I have been through the exact same scenarios in the past. Therefore, I intend to spend some time here in explaining more fully how the model works and why I am still so confident that it will be accurate in its prediction of a major decline.
I want to begin by stressing that I am going to make this explanation as simple as possible so as to eliminate the possibility of confusion. For this reason, if the workings of the model seem too simplistic you can be sure that is not the case. I am merely relaying it in this manner for illustrative purposes. So let’s start by reiterating in the strongest possible terms that we still have a sell signal in place and the model is still forecasting a major decline. Furthermore, unlike other sell signals issued in the past, this signal is forecasting not only a crash but also the onslaught of a bear market. Remember, technically, even the crash of 1987 did not usher in a true bear market. Rather, since the lows of 1987 did not break the lows of the previous year, we could not classify that as a bear market. (I realize that many have called even more moderate declines, such as 1990 or 1998, bear markets but according to classical technical analysis, they were not).
Even though the model predicted these past events, it has never yet since the beginning of the bull market in August 1982 forecasted the start of a bear market. That is why this is so much different than past times and why it is so dangerous to be in the market right now. Bear markets (real ones) are notorious for their ferocity and those that think they can just weather the storm will be devastated.
Now I am going to use a number format to illustrate how the strength of a signal is determined and how that can be used to anticipate the immediacy of the move being forecast. (Again, this is not how the model actually works but it is the best way to explain it to someone who cannot see the actual makeup of the model, which is proprietary). Let’s say that when the various indicators in the model produce a cumulative value of 100, a sell signal is generated. That means that the environment has become very dangerous and it is unwise to remain invested. Furthermore any unexpected external shock could immediately push the readings to ‘critical mass’ causing the market to collapse. Critical mass is a level beyond the initial reading that is so negative that the effects on the market are overwhelming. However, it is vital to remember that the advance necessary to move to that critical mass level is relatively small. In 1987, for example, we received our initial sell signal in early September. Using the above-described numbering system to illustrate, it took until mid-October before the readings were at critical mass, and most of that advance occurred in just two weeks in October. Numerically, the readings would have equated to a reading of only approximately 110 to initiate the collapse that began October 16 and lasted into October 19 and 20. So, as you can see, the additional increase necessary to produce the beginning of the crash was not that great. That is why I was so adamant at the end of October of this year that we get out of the market; the readings were advancing so quickly that they could have reached critical mass at almost any time. And although they have continued to advance and remain in sell signal territory, the rate of acceleration has not been so dramatic as before and that (along with favorable seasonality) is why the market has been able to keep moving higher, temporarily ignoring the danger. So, you may ask, why did we come out of the market when we did? Well, please understand that the readings can reach critical mass very quickly (within as little as a couple of days, even without an external event) and so to remain in the market is very dangerous. (Remember, though, that I did not advocate any large leveraged positions due to the very fact that we had still not gotten to critical mass). Exiting your stock holdings when the market is collapsing is very difficult and it is very dangerous to wait. Take the example of 1987 again. Many people knew the market was extremely overvalued all through the summer and early fall of that year. Yet, most advisors said that there was nothing to worry about and unless many things changed, the market would continue advancing. They argued that interest rates were still fairly low (at least compared to the early ‘80’s), productivity was high, oil was plentiful and certainly not as expensive as during past times, and we were on the verge of a technological revolution, among other things. They said that the huge trade imbalance, weak dollar, excessive debt and other similar worries were simply irrelevant. So, most remained in the market, thinking they would have time to come out when it became obvious that there was trouble. What happened? Well, the market basically chopped around, going higher and then lower and then higher. Glamorous stocks like IBM surged to new highs (IBM has just recently returned to the price level of 1987!). Everyone was convinced that the market was ‘bullet proof.’ (I am sure this all sounds familiar). Then suddenly, without warning to most, the market suffered its first 100-point down day on Friday October 16 (that was a huge move at that level). The entire weekend newswires were filled with reports about the market. Fear and panic set in to such an extent that when the market opened for business on Monday October 19, it simply collapsed. Many stocks did not even open for hours. Those investors that tried to get out were either unable or had to do so at much lower prices than just days before. That is the way the market always works. To think that this time will be any different is foolish.
So what is it then that I am referring to by saying that we will know when the collapse is imminent? Well quite simply, when the readings in the model reach critical mass, we will know the end is very near. Then we will be able to take on leveraged positions to profit from the decline if we desire. That is what I have been waiting for and planning for. But again, when we issued the sell signal we were very close (to use our numbering system, we are currently at around 108 and early in November we were at 107) to critical mass and we can get there at almost any time. Furthermore, unless the signal completely reverses (which has never happened) I believe we will definitely get to critical mass sometime very soon. As I wrote about previously, there is a normal lag time for the market to react after a sell signal So despite the fact that the market has temporarily moved higher, we must take a longer-term view. Why worry about missing the last few percent of a bull market (that we have been long in for years at various times) when the market is in danger of a 40 to 60% decline. Now you may say that is not possible. Not only is it possible, but also when a bear market begins it will be almost inevitable. As recently as the 1973-1975 period, we saw the DJIA lose 50% of its value. Highflying stocks (like the Yahoos of today, for example) lost 90% of their value. Additionally, look at the Japanese example. Their market peaked ten years ago this month at almost 40,000. It lost 75% of its value during the intervening years and is still only at 18,000, less than half its ten year ago level. So do not make the assumption that bear market moves like that are things from the distant past (the dirty thirties). They are still part of the investment scene and will be felt very, very soon.
To sum up, the readings in the model are advancing more quickly again and I am on high alert. If this advance continues we will definitely see a massive sell off begin soon—probably in January and continuing on for at least a couple of months. So this is no time to be faltering in your resolve. The market is dangerous, it is vastly overvalued, and it will go down soon. Remember, this forecast is coming from an advisor that has been bullish throughout most of this bull market and who has made substantial profits from the up moves as well as the down. But this is so obvious to me now that to soften my stance or hedge or make excuses would be tantamount to negligence. Hang in there. We are very close. I will keep you posted. Take care and have a wonderful holiday season. And of course it goes without saying that I wish all of you a very happy and prosperous New Year.
JAS, Inc. Market Timing Service January 28, 2000
AU REVOIR!
A Few Expressions I Will Be Glad To Say ‘Goodbye’ To
There are so many sayings these days that have no real value to them except to justify high stock prices that it is truly amazing. We hear them every day and, like the old truism states, “if you tell yourself something long enough you will tend to believe it.” That is the case with most investors these days: they simply have come to believe that what they have heard repeatedly for so long must be true. But, obviously, truth is truth and myth is myth no matter how we spin it!
Let’s take one very prevalent saying as an example of what I am talking about. I know you have all heard it many times. Here it is: “They Beat the Street.” But just what does that mean? Does it mean, as it implies, that the company’s earnings were great, or better, or improved over last quarter, last year, etc. NOT NECESSARILY! All it really means is that they beat the estimate of earnings that was forecast by the analysts that follow the stock. In reality, their earnings might have been dismal compared to last year, but all that matters is that “they beat the street” as per the estimates compiled by some of the forecasting enterprises that have polled the various analysts and come up with a consensus number. Take Gillette as one recent example of this kind of misleading reporting and hype. Even though they exactly met their earnings forecast for the 4th quarter of 1999, their earnings were actually 30% lower than the previous year’s 4th quarter. Yet the stock did okay because the only thing investors cared about was that they “beat the street.” (In this case they met the street). What a silly and dangerous way to evaluate the health of a company. Yet this is the current modus operandi on Wall Street these days. No matter how bad the real news is, the spin that is put on it by relating the results to the forecast is all that counts. This is no way to invest in the market and will lead to disaster.
Here’s another popular saying: “Technology isn’t affected by (that, or this or the other).” Oh really? Just tell me, to use one example, why such things as higher energy costs or rising interest rates do not affect technology companies. Aren’t they subject to the same costs of doing business as everyone else? True, energy may not be as much of a direct component of their operating costs but it obviously has an influence. Their customers (consumers and businesses alike) are very definitely affected by sharp rises in costs. Likewise, rising interest rates directly and indirectly affect these companies by not only increasing their cost of doing business but also by reducing the pool of disposable dollars that is available to purchase the products they produce. So, to think that these companies are immune to significant changes in the business climate is ludicrous. Yet, again, many investors have been conditioned to believe that is the case.
How about this one: “Such and such analyst is calling for a 20%, 30%, 40% (or whatever) increase in the major averages this year.” Yet, if you analyze the analysts (sorry about that) you will quickly conclude that they are not very objective at all. Virtually all of the analysts that are paraded in front of the public on the various investment programs each day are employed by major brokerages, mutual fund companies or banks. Do you really think that these analysts are going to threaten their own livelihood by suggesting that stocks are likely to go down soon? Of course not! They will always try to impart the idea that “over the long run, stocks are the best investment.” That may be true, but there are times when stocks are the very worst investment but you will never hear many of these analysts making that assessment. The few brave ones that have been even slightly negative have either been fired or discredited.
Here’s one that really gets to me: “They had a record first day pop.” Of course, you know that this means that the company had a huge increase in stock price when it first came to market during its IPO (initial public offering). But that has little to do with anything other than hype. Yes, there are sometimes good companies that go public and eventually justify their high stock price. But for the most part, and certainly in a market about to change like this one is, they prove to be a great disappointment. Remember that the real purpose of the stock market is to provide capital to growing companies by allowing investors to share in their ownership and profits. It was never intended to be a gambling enterprise where the name of the game is to catch the next high flyer. Furthermore, investing based on nothing more than the hope of selling the stock to someone else later at a higher price is gambling.
Here is one last example (although I could cite many more): “They expect to be profitable in 2002, or ’03 or maybe ’05, etc.” This one is really an extension of the previous example. Usually it relates to a company that has a capitalization in the billions of dollars but has never made a profit. That cannot go on indefinitely, no matter how intensive the hype.
All of these examples are evidence, not of a healthy stock market, but of one that has become a speculative bubble that is about to burst. I have no doubt that we are right and that we will be richly rewarded for our viewpoint.
Where Are We Now?
Well, as you know, we are expecting a very sharp decline in the stock market based on the sell signal received in the model at the end of October. But just to put this in perspective, let me point out that although some time has elapsed, nothing has changed. First of all, there have been several examples of when the delay from the initial sell signal was as long as has been the current case, especially if you eliminate the last two weeks of December for purposes of calculating the lag time. I believe this is appropriate since the last two weeks of December has never seen much significant activity on the downside. Furthermore, there was an additional amount of liquidity created to protect against Y2K problems that found its way into the stock market in late December, obviously artificially affecting the balance. But it is my contention now that the market began breaking down immediately after the second week of January. The DJIA peaked then and has been substantially weaker ever since, and clearly on a downtrend. The NASDAQ, which has seen unbelievable volatility since the beginning of the year, appears to have had a clear key reversal as of this past Monday. On that day, the NASDAQ made a new high and then, on record volume, closed lower than the previous day. Since then, the index has been under substantial pressure and I believe we have seen a very important turning point in it. So it is my belief that we have seen the beginning of the big decline as of about two weeks ago. But how do things progress from here?
Well, it is very important to remember that so long as we are in a sell signal, the market is very, very dangerous. As I explained previously, we are awaiting readings that are so negative (that I refer to as ‘critical mass’) that the market will be immediately overwhelmed. When I issued the initial sell signal, we were very near critical mass and could have gotten there at any time. That is why I advised coming out of the market, and I stand by that approach. With a market poised to decline 50% to 60%, it is just too dangerous to hang around for the last little bit of profit. We will have great opportunities to get back into the market once the bear market ends, at fabulous prices with little real risk. That is the way to invest in the stock market, not to wait until it is too late to take your profits.
As for right now, we are exceedingly close to that point I call critical mass. You could liken it to a runaway cart approaching the edge of a cliff. To use this analogy, we have already begun the initial decline, and are gathering momentum. As we approach the edge of the cliff (just as we reach critical mass) it will become apparent to many that the market is about to tank. But for them it will be too late, because once we start over the edge of the cliff, the selling will be too fierce to operate in. Huge declines will cause paralysis and then abject panic. How do I know? Because human beings are still in control of the market and they will act just as they always have in the past.
I assure you, we are very close to the end of this bull market. We should be completely out of stocks now and into long term U.S. Treasury Bonds, which will do very well as the stock market collapses. This is because there will be ‘flight to quality buying’ of Bonds as well as buying because the stock market collapse will be forecasting a much weaker economy ahead, a strong positive for Bonds. Even if rates inch a little higher in the short term, it is still better to stay with your positions because once the selling starts in earnest in the stock market, it will be almost impossible to get into long term bonds as a reasonable price. So hang in there, we are very close.
JAS, Inc. Market Timing Service February 25, 2000
AT LAST!
I Finally Get It!
I have struggled for a long time with this concept of the “new economy” versus the “old economy.” I have wondered and pondered about how stocks involved in the new economy could continue to advance, even without earnings in many cases, to levels undreamed of only a short while ago. After all, the analysts are continuing to promote these stocks, calling for ever higher price targets, with no real reasons why. I knew they must know something I didn’t but until just recently I did not know what that ‘something’ was. Then it dawned on me. The reason stocks in the new economy category can continue to rise, ad infinitum, is because all of those millions of employees of the old economy companies will have nothing to do but spend their time and their money online. When the companies such as 3M, Merck, General Electric, General Motors, etc., have reduced their workforces to practically nothing in the traditional areas of the economy, all of those displaced persons will have nothing to do but be online. It won’t matter that they won’t have any income; they can more than make up for it by day trading the new economy stocks. That’s it. That must be what will happen. Does that sound ridiculous? Well obviously it is an exaggerated description but there is much truth in this analysis. In reality, this is essentially what the promoters and analysts are saying: that the new economy is all that really matters and the old economy is irrelevant. Of course, I believe nothing could be further from the truth.
As I have been saying and writing about for some time, the most damaging effect that the current changes in the economic environment will have on all new economy companies is the reduction of the consumers’ ability to purchase their products and services. That is why they are not immune to the old mundane cause and effect concept. Think about it. If a consumer must pay much more in interest costs and energy costs, will he have the same disposable income available as previously to purchase these goods and services? The obvious answer is no but with some distinction necessary. You see, the consumer currently feels richer due in large measure to the wealth effect of the increasing value of investment portfolios. This has become a self-feeding phenomenon. When the value of one’s holdings increase, one feels more comfortable in committing funds to other discretionary areas. Some of those areas of spending contribute to the appeal of companies that benefit from that spending and their stock prices increase even more. The consumer feels even better and spends even more and so on. Yet, you must realize that this cannot continue indefinitely. There is a limit to how much these companies can be hyped and to the extent that their stocks can trade at never before seen multiples. Furthermore, with the consumer (their customers) in a much different situation than even a year ago, that limit is about to be reached.
Economy at Growth Limit
The wealth effect I alluded to previously is something that is very important to us because it is the focus of the Fed. Now I wish to make it clear that it is not necessary at all for official action in order for us to get a sell signal in the model nor is it necessary for the Fed to take action for the market to collapse. However, there is often a confluence of these events at critical turning points. That is, the Fed has made it clear that they will continue to focus on the economy growing too quickly and will take measures to prevent that. Mr. Greenspan made it very clear that the Fed would move again to protect against an overheating economy. Today, we got word that the 4th quarter GDP was revised upward to 6.9%. This is remarkable and clearly shows that the consumer is on a spending binge. Much of the increase, in fact, was due to consumer spending. Combine this with the fact that we are importing goods at record levels (the trade deficit increased more than 60% year over year from 1998 to 1999) and you can be assured that the Fed will move again very decisively. However, the mere expectation that they will move again will be enough to keep the pressure on short-term rates. With these rates already at very high levels, it will not be long before the consumer will be sharply affected. Rising interest rates, as I have said, are never good for stock prices. It is only a matter of time before that realization hits the stock market like a sledgehammer.
Extreme Volatility Evidence of Major Change Just Ahead
Whenever we see the kind of volatility that we have recently seen, we can be assured that it is forecasting a major change in trend. Of course, we have already seen the DJIA and the S&P indices react to the sell signal issued late last year (within the normal lag time) but so far the NASDAQ (for reasons previously discussed) has ignored the danger. True, only a handful of stocks have given the illusion of overall strength, but nevertheless one cannot ignore the blaring headlines of new record closes. Yet, I am certain the recent volatility in the NASDAQ is clear evidence that that index is about to collapse as well. Consider this: eight of the ten largest point gains in the history of the NASDAQ have occurred this year! That is almost unbelievable, yet it points out the almost complete complacency the average investor currently has. Despite the clear warning of higher interest rates, surging energy prices and the sharp decline of most stock prices, investors in the tech sector temporarily feel as though nothing is the matter. As previously discussed, they believe nothing can go wrong with these new economy companies. I believe they, like all companies, will be affected just as they always have been. And, investors will react just as they always have. Fear will set in and then panic. Just prior to that, we will get to readings of critical mass in the model. We are close to that point.
Some of you have asked why I have not recommended more leverage since I expect to see critical mass readings in the model soon. The reason is, of course, that we may stay for awhile at these readings which, to use my previous metaphor, is like a football team being right at the goal line but not having yet pushed into the end zone. We must wait until we get to critical mass before we can expect a massive reaction in the market. Otherwise, we could see the market continue this current downtrend for some time and that would make leveraged positions unprofitable. So we must remain patient. We are close but we cannot jump the gun. Meanwhile, our bond positions have done well and we can sleep well, avoiding the current turbulence and awaiting even greater opportunity. Remember, whatever potential profits may have been left on the table in the NASDAQ mania will be more than made up for in the coming environment. I believe we will have the greatest opportunities we will ever see, over the next few years, as stocks collapse to bargain basement levels and we begin to buy. These are the kind of eras that produce family dynasties. Consider that the vast majority of the wealth of the two richest individuals in this country (Bill Gates and Warren Buffet) has largely been created by the great bull market that has been in effect since 1982. That is the power of being in stocks at the right time and out when the risk is so enormous. Remember too, from the time we issued a buy signal in September 1998 until we issued a sell signal last year, the NASDAQ gained 61%. That is not too bad and although it has continued to advance, the latest advance has been very narrow and the average investor has seen little overall gain in their portfolio. So the point is, the model continues to work and I am even more excited about its application and potential for us over the coming months. I will keep you posted. Take care.
JAS, Inc. Market Timing Service March 31, 2000
OKAY
It’s Time To Get A Few Things Straight!
There have been many statements made recently that many investors, to their own detriment, may be inclined to believe with respect to the markets. Of course, this is always common at very important junctions but understanding fact from fiction has probably never been more vital than it is right now. I sincerely believe, as you will soon see, that your very financial future depends on a clear understanding of where we are and where we are going. This is serious.
First and foremost, I must reiterate that it is my belief that we have already entered into a bear market with respect to the stock market. I believe it began in January and has progressed in a fairly normal fashion since then. The model, by issuing a sell signal late last year, correctly forecast its onslaught, I believe. However, I also need to strongly reiterate that just because we have entered into a bear market does not mean that we will get an immediate market crash. A market crash will not occur until we get to critical mass readings in the model. I believe we will get there very soon but meanwhile, the market is still a very dangerous place to be as evidenced by the recent activity. The important thing to remember is that a bear market can be one that slowly grinds its way lower over a long period of time or one that massively collapses and recovers somewhat quicker. I am convinced that we will experience the latter, but again, the major selling will not get underway until we get to critical mass. Now I wish to make it very clear that this is nothing new. There was a delay in getting to critical mass after the initial sell signals in 1929 and 1987, although not quite as long. But that does not change the fact that the model was indicating substantial declines ahead in those periods as it is now. I also need to remind you that the lack of a crash so far does not change my opinion in any way about the accuracy of the signal in the model. I have not recommended aggressive shorting tactics for the very reason that we have not reached critical mass yet. But we have still taken measures that have done two very important things: 1. We have gotten out of a very dangerous stock market, and 2. We have invested in areas that have done very well.
Now I realize the headlines make things appear differently than they really are at times and so some illumination is in order. As I said, my premise is that the bull market ended in January of this year. The DJIA peaked then at 11,700. Since then, it has had a very sharp decline and then an approximate 2/3 retracement, a normal technical rebound. After reaching its 2/3-retracement level, it has resumed its downtrend. From its peak, it is still down about 6%. As for the NASDAQ, it has been unbelievably volatile and this volatility, I believe, is a clear warning that it is about to collapse. Despite all the hoopla, the NASDAQ is up just over 9% since my identifying point of the end of the bull market in general, and most of this advance has been very, very narrow. Only if you were very lucky or, very smart and brave, could you have achieved these returns by investing in the few individual stocks that have done well. The S&P 500, for the same period, is up 1.5%, hardly any return at all. (Even since October, the DJIA is up only about 5% and the S&P 500 only about 14%). And remember, because of the formulation of the S&P 500, it is now dramatically influenced by many of the same technology stocks that have risen to unbelievable and unsustainable levels. Companies such as AOL, Advanced Micro Devices, Applied Materials, Cisco, Oracle, Qualcomm, Sun Microsystems and Yahoo are just some of the reasons why that index has temporarily outperformed the DJIA. Yet many of these stocks have risen to astronomical levels based on very unsound reasoning. For example, Cisco, which recently became the world’s most valuable company, has a P/E ratio of over 200. Furthermore, in order to justify this, some assumptions for earnings growth have had to be made by the analysts that tout the stock. If you were to extrapolate these assumptions of earnings growth out into the future 10 or 12 years and maintained the same P/E ratio, Cisco would be worth more than the GDP of the United States! Does any reasonable person really expect that to happen? So please, don’t allow yourselves to get caught up in the nonsense. It will lead to disaster. When the tech bubble bursts, as it now appears to be in the process of doing, these stocks will plummet and so will the S&P and NASDAQ indices. Recently, even some very well known analysts have begun to realize the risks in this market, but they do not comprehend the true magnitude of the danger.
But what about our positions? Well, as you know, I have advised that the majority of our money be in US Treasury Bonds. How have they done during the same period? Well, for the first quarter of the year they have increased by about 8% in price. Their cumulative return for the quarter, including accrued interest, is close to 10%. Furthermore, as the stock market really starts to melt down when we get to critical mass, there will be a dramatic flight to quality into Bonds and their price should explode. So we currently have the best of both worlds: we are avoiding the danger in the stock market and benefiting from our current investments. Additionally, when the stock market really collapses after we get to critical mass, those who have participated in shorting the market will achieve returns that will dwarf the returns made even by the highest-flying tech stocks. Then, when the model issues a buy signal at some point in the future, we will be buying stocks in good companies at 10 or 20 or 30 cents on the dollar! That is the way to approach this market. That is the way to be a successful investor.
What’s Ahead?
As I mentioned in a recent telephone update, the readings in the model did moderate again last week very slightly. However, the preliminary numbers I received this week show resumption in the up trend of the readings and so we are again making progress toward critical mass. I believe we could be there in a matter of a week or two if this continues. (Of course, we cannot jump the gun and must wait for the readings to become clear; I realize we have been waiting but the importance of this dictates further patience). This could very well coincide with a lot of important external developments. For example, as has been widely reported recently, the lockup period for many of the Internet stocks that had been floated via IPO’s will start to expire soon. When this happens, there could be a flood of stocks for sale by insiders anxious to lock in their profits. This, in conjunction with what is already going on in the tech sector, could lead to an avalanche of selling, margin calls and panic. Obviously, this would be what I would expect as we get to critical mass readings in the model.
There are many other supporting reasons why I believe we are now extremely close to a collapse in the stock market. Certainly, the yield curve inversion (where short-term interest rates exceed long-term interest rates) is very significant and has accurately forecast major trouble ahead in the past.
The obvious FED stance to continue to raise interest rates to slow down the economy is also significant. And contrary to what some have been saying, there is, in conjunction with official interest rate hikes, been a draining of liquidity. M1 has dropped precipitously from January and the decline in the Adjusted Monetary Base has been accelerating, recently reaching a compounded annual rate of change of –25% for the period ending March 22. These are clear signs that the liquidity that has been responsible for this investment bubble is quickly disappearing.
Many have argued that the market can never decline as long as money is flowing into stock funds. Then please tell me why we have seen the recent sharp declines when same-time figures showed record inflows into stock funds? The reason, of course, is that the public is the buyer and the sellers are the ‘smart money investors.’ This always happens at the very end of a bull market; weak hands are buyers, strong hands are sellers. Remember, for every trade there must be both a buyer and a seller. So don’t be confused by this argument. It will fail as the market comes crashing down.
In summation, we are very close to some real fireworks. We are doing very well with our positions. When the proper time comes, we will take more aggressive positions with respect to the market crash. Meanwhile, be patient, relax and enjoy your restful nights. Most other investors are currently not able to.
JAS, Inc. Market Timing Service April 28, 2000
ANSWERS
TO SOME COMMON QUESTIONS
I have been asked a number of questions about the market lately that have common themes and so I thought this would be a good opportunity to comment on them. Certainly, the answers to many of these questions are of vital importance to all of us. So let’s get started.
First and foremost, yes I still very much expect a market crash. This is because we are, for the first time in nearly two decades, transitioning from a bull market to a bear market. This means that the magnitude of the sell off will be much larger than events that have taken place within the ongoing bull market. That is, even the crash of 1987 was really nothing more than a very sharp bull market correction. So the main thing we must realize is that this move down, once it really gets started, should be most dramatic. But, you may ask, what is the difference between now and other times we have had sell signals in the model? Well, we must remember that a sell signal does not always predict a crash. It has always accurately predicted every major move in the market, both up and down, but every sell signal does not mean that a crash is imminent. In fact, until the readings get to what I call critical mass, the market is unlikely to crash. Some of those non-critical-mass signals occurred in 1984, 1990 and 1994 for example. In each case the market moved down, sometimes substantially, but we did not experience a dramatic crash. This is obviously of vital importance to us. If the market is not about to crash, one must be much more careful about utilizing leveraged instruments. Furthermore, after events such as the above sell signal examples that took place during an ongoing bull market, the emphasis was to look for opportunities to immediately re-enter the market after the selling was over. In fact, some of our most profitable buy signals were generated during these very periods. But now, things are different.
Many factors have come together to convince me that we are now in the process of entering into a bear market. First and foremost, of course, is the strength of the sell signal in the model and its close proximity to critical mass levels. With the market still more overvalued than any in history, and with the firm belief by almost everyone that the market could never crash, the danger couldn’t be greater. Besides all of these factors, I use other means to identify the end of a bull market, some of them extraneous to but reinforcing what the model is telling us. My cycle work, for example, clearly shows the beginning of the end of this bull market. Economic conditions, meteorological similarities to conditions that existed during past downturns, and enormous public participation in the markets are other red flags. I frequently try to comment on some of these issues because they support my premise and since I do not intend to reveal the actual makeup of the model, they are one way I can relay important information to you. But do not be dismayed when the market does not immediately react to news items or economic data that we have commented on.
For example, some of you have asked why the market did not tank with the release of the recent ECI and GDP reports. The simple reason is because those bad numbers were already in the market. The market was expecting bad numbers. Do not fall into the common trap of being reactionary. That is the downfall of almost every investor. Rather, the way to profit consistently in the markets is to have a plan that works and stick to it. In our case, the model has been our very reliable guide and continues to be. Remember that the market will always do what it needs to do to fool the majority at critical turning points, so just because the market did not immediately react to bad news is not important. Very soon it will react to the systemic change that has taken place in the environment. At that point, as we get to critical mass readings, we will see an all out collapse. Yet, you may ask, “haven’t you said that a catalyst usually sparks the selling?” Yes that is often true, but remember that at those times, such as just before the release of the trade data that helped start the crash of 1987, the model was already at critical mass readings and so it was ready to be influenced by bad news. Similarly, the current environment, though very dangerous, will not turn into a meltdown until critical mass is reached.
Some of you have asked, “How can the market crash when long term rates are actually falling?” First of all, don’t be confused by how we define long-term rates. It is true that T-Bond rates have fallen sharply, as I expected. But that is due largely to special circumstances. As the stock market began its recent decline, there was a flight to quality. Additionally, as a result of the recent booming economy and large current account surpluses, some of the outstanding Federal debt is being retired by repurchasing T-Bonds. Furthermore, the T-Bond is one of the most heavily traded instruments on the commodity exchanges and is often subject to wild trading fluctuations. For these reasons, and others, I have never used the T-Bond in any of my work. It is not a component of the model. If, however, you look at other measurements of long-term interest rates, you will get a different picture. Corporate rates (those rates that have a much more direct effect on corporations) are much higher than a year ago. This is the real story: interest rates in the ‘real world’ that actually affect corporate bottom lines are beginning to take a serious toll on business. So, again, don’t be deluded into thinking the market cannot crash just because T-Bond rates are low.
Inflation is a major issue and, as I have been saying for some time, is now having a deleterious effect on the economy. I realize some of you have correctly pointed out that, up until just recently, the actual CPI and PPI data seemed rather benign. But if you look at the trend you will see a different picture. For example, the way I measure inflation at the wholesale level is on a year over year basis.
That way, the need to seasonally adjust the data (which can lead to errors) is eliminated. What that data is showing me now is that inflation at the wholesale level is getting much stronger. It is at nearly 5% on an annual basis as of the March data, compared to 7/10 of 1% in March of 1999. That is a dramatic increase and the effects of those changes are inexorably working their way into the economy.
There are many other issues I could deal with except for the fact that I have promised I would not be sending out a “book” in these updates. I will try to address other issues in verbal updates and in future hard copy updates. However, one area I feel I must comment on now is the fear that the market can never crash due to ‘crash protection measures.’ While it is true that markets that are merely selling off sharply can be supported by measures such as these, it is clear to me that such measures will ultimately fail when the selling really gets started. In 1929, for example, there was a consortium of banks and brokerages that had the intention of supporting the market during major declines. This worked well until the selling really intensified in late October. Then, this pool of money was simply overwhelmed by panic, forced selling and immense selling volume. Similarly, when we get to critical mass and the market begins it crash, there will not be enough money available to stop it. If you don’t believe me just look at the many recent examples of government intervention in the currency markets. At times, our government and others have combined to throw in literally tens of billions of dollars to stabilize a currency, often without effect. When a huge market is determined to move, it cannot be stopped. In fact, the very failure of these measures in the coming stock market crash will likely lead to even more panic. So, ironically, this strategy may well produce the exact opposite result intended.
Lastly, let me quickly comment on how this crash scenario is likely to play out. Will we have a deflationary, debt-driven depression emerge after a crash, or will the Fed be forced to pump up the economy so much that an inflationary environment emerges? Right now, I believe the odds are still at least 90% that the deflationary environment is more likely. But with inflation now running at nearly 5%, we must watch very carefully what happens after the crash. If inflation is rekindled in any major way, we will have to exit our bond positions and take measures that will take advantage of an inflationary environment. As always, the model will tell us what to do. As for the readings currently, we are back to the highest levels we have been at so far. This means that almost any additional advance will get us to critical mass levels. So, obviously we must remain alert. The next year or so could very well make the difference between disaster and great prosperity. Make sure you keep in touch.
JAS, Inc. Market Advisory Service May 26, 2000
Rain?
Or Shine?
It recently occurred to me how ridiculous it would be if weather forecasters had the same mentality as many of the stock analysts and gurus do these days. Even if it were pouring rain, they would be obliged to talk only about sunshine no matter what. If their meteorological data showed rain ahead for the weekend, they would pronounce that the weekend looked fantastic. Isn’t this, as silly as it sounds, exactly what most stock forecasters are saying nowadays? No matter how extreme the pain many of their followers are experiencing, they keep saying “don’t worry, be happy.” (By the way, I am sure you remember that that slogan was the title of a song that came out right after the crash of 1987). And just like the person who would plan their weekend according to the weather forecast and then get rained out, investors are no doubt getting a little weary of being told that everything is okay.
In fact, as much as the major indices are off their highs, the reality is that the overall market is much weaker. Many portfolios are down much more than even the close to 40% decline we have seen in the NASDAQ. Particularly those investors that jumped into the Internet sector, on the urging of some of these same analysts I referred to earlier, have seen their holdings plunge. Yet, the ‘cheerleaders’ keep telling them to hold on for the long term. That has proven to be a successful strategy in the past but it does not look good for the near future. The reason, of course, is that we are now in a completely different environment than we have been in for the last 18 years. So many of the ‘professionals’ that have entered into the business in the last five or ten years have absolutely no idea what kind of changes have taken place and what lies ahead. Frankly, neither would I except for the model. Of course, I have studied extensively other eras that resembled the current environment and have personally been through some very wild markets. Yet, as far as timing the actual beginning of a bear market or major collapse, without the model, I would have to rely mainly on mostly unreliable technical analysis. (I say unreliable because most technical analysis is incapable of predicting major changes in market direction).
In this period of uncertainty (for most) there are also many analysts that have been perpetually bearish that are now saying, “I told you so.” This is just as useless as the former analysts that never see anything but blue skies. Many of these perma-bears have had their clients out of the market for years and have missed fantastic opportunities. So the point I am making in all of this is that you should ignore most of the rhetoric you have heard and will be hearing. Most of it is simply self-serving rubbish.
Now as you know, the model turned negative at the end of October last year. Since then the market has been both up and down but is now clearly beginning the final episode of this transition from bull to bear. Yet many of you have asked, “why has it taken so long for us to get to critical mass and the subsequent breakdown in the market we are looking for?” The fact is, just because we got an initial sell signal, in and of itself, does not mean that the market is in imminent danger of major collapse (however, it does mean that the market is very dangerous and could progress to crash levels at almost any time). There have been several times over the last ten years when a sell signal did not progress to critical mass (and the massive decline in the stock market that would be predicting). In fact, 1987 was the last time that the model actually progressed to critical mass and yet even that did not end up turning into a true bear market. So why am I so convinced that this time things are different? Well, we are extremely close to critical mass readings and could get there virtually at any time. Second, this market recently exceeded every prior example of excessive valuation and sheer speculation. Third, my cycle work clearly confirms that we are transitioning to a different environment. So all of that, and more, convinces me that we are, in fact, seeing the end of the greatest bull market in history. Does that make me happy? Only to the extent that my clients can profit from the knowledge! Other than that, I have no underlying character trait that predisposes me to be bearishly inclined. I remind you that most of the time the model, and therefore myself, have been bullish. It just so happens though, that this impending stock crash and bear market are so potentially powerful that we likely will never see anything like it in our lifetime. So, first and foremost, we must not get in the way of it (protect our capital) and second, if we desire, we should take advantage of a situation that is inevitable. That means, that no matter what we do, this event is going to happen. That is why we can have a clear conscience no matter how bad things get for the average investor. Furthermore, after this selling is over with, we will at some point be re-entering the market on the long side. Once we get the next buy signal, we will be buying quality stocks at bargain-basement prices. That is perhaps the most exciting prospect of all. During previous bear markets, stocks in good companies have sold for 3 to 5 times earnings. As business conditions improved, those stock prices skyrocketed. So, with us having the financial wherewithal to buy stocks under those circumstances, we will be able to amass huge holdings. So let us neither be bulls nor bears. Let us rather be pragmatists.
Perception vs. Reality
I realize much of the data released and how it is interpreted is very confusing these days. Particularly confusing are inflation data. I thought I would spend some time addressing that issue. I know you have heard me talk about inflation frequently lately. While it is true that I have pointed out the reemergence of some inflation, I do not at this point expect it to become a major problem. You see, the only reason inflation data is important to us right now is that it has kept pressure on interest rates. Interest rates are very important to stock prices and so the prospect of higher rates is a negative. The Federal Reserve is focused on inflation data and the potential for inflation in the future because they must be proactive. They cannot wait for the future to see what will happen. At the first threat of inflation, they must take action to forestall any meaningful breakout. Therefore, they look at a variety of data to determine how likely the potential inflationary risk is. Then they must take action. So when I refer to clear evidences of inflationary pressures, it is really more to identify those things the Fed will be looking at and indeed the interest rate market itself. But I do not, at this point, expect that we will see much real inflation. The main reason is debt. This economy is so saddled with debt, (personal, corporate and national), that the most likely scenario to emerge after a stock crash is a deflationary black hole. This is because as financial assets collapse in value, debt will become a very real force. It will necessitate even more selling of assets to service and this will become a vicious cycle. Eventually, it will become self-feeding, as drops in asset values force more selling which in turn causes even larger declines in asset values. This is exactly what happened in the 1930’s and at the moment is the most likely environment on the horizon. That is why we are in T-Bonds: they will benefit greatly from a slower business climate in the future, as well as flight-to-quality buying. Unless the Fed manages to reinflate immediately after the crash, this is how things will probably evolve. But of course, we must keep a close eye on how this event is handled. As well, the model will tell us whether or not we should remain in Bonds. We will see.
Great Opportunity
Finally, as we go into the beginning of summer I want to remind all of us how lucky we are. Thanks to the sacrifices of so many, we can enjoy the benefits of living in the greatest country in the world. That means, in addition to all the other blessings we enjoy, we can fearlessly make decisions about the investment environment and profit from its direction, no matter what that may be. That is one very important benefit of freedom. Have a safe and happy Memorial Day!
After considering all the above, how did the model do from 1999 through 2002? Let the following chart speak for itself.
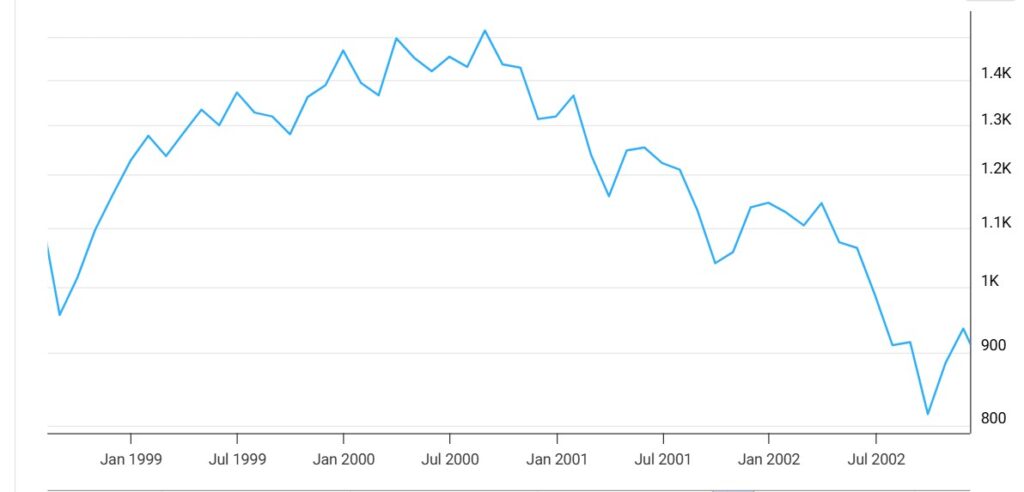
S&P 500 Index
From high to low, 2000-2002, the S&P 500 lost nearly 50%! NASDAQ lost much more and took years to regain its high. Meanwhile, we made substantial gains in our positions without any losses in stocks.
Disclaimer: The information provided is for educational purposes only and should not be construed as investment advice. Financial markets involve risk, and past performance is not indicative of future results. Readers should consult a qualified financial professional before making any investment decisions.
