
Federal Reserve Interventions
How Federal Reserve interventions have repeatedly inflated asset bubbles—each more dangerous than the last.
As this article will show, the Fed is now trapped by its own past actions—and the consequences for investors who are unprepared will be severe.
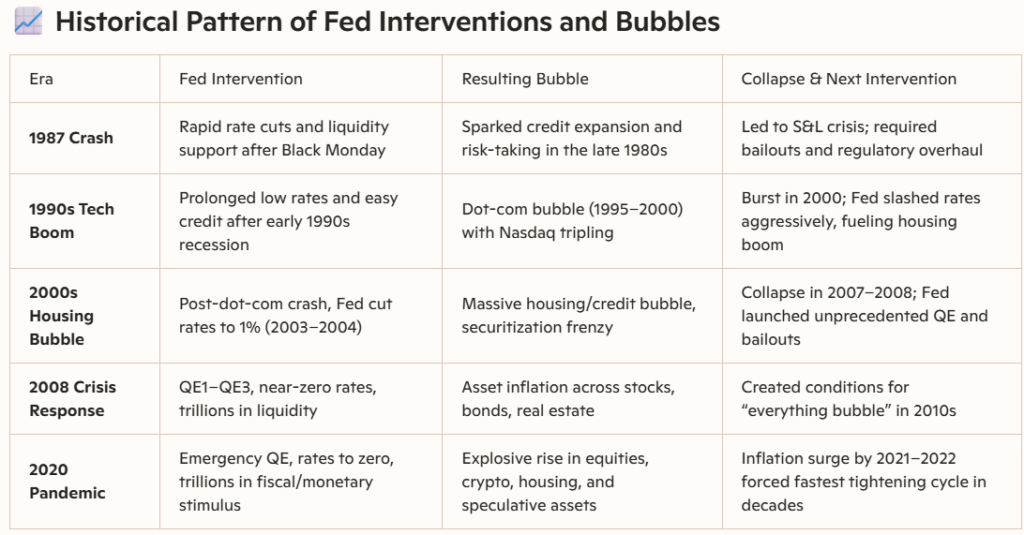
As is evident in the above table, and as I clearly warned in my newsletters published during those times, Major Federal Reserve interventions—especially aggressive interest rate cuts and liquidity injections—have repeatedly fueled asset bubbles. When those bubbles burst, the Fed has responded with even larger interventions, creating a cycle where each rescue plants the seeds for the next, bigger crisis.
What makes this cycle especially dangerous is not that the Federal Reserve intervened—but that each intervention required a larger, more aggressive response than the last. The result is a system now dependent on perpetual stimulus, with no painless exit. History shows what happens next.
Why Federal Reserve Policy Creates Market Bubbles
At the core of every modern financial bubble lies a common catalyst: artificially suppressed interest rates and excessive liquidity. The Federal Reserve, tasked with stabilizing the economy, has increasingly attempted to fine-tune complex global forces through blunt policy tools. While these interventions may delay short-term pain, they consistently produce long-term distortions in asset prices.
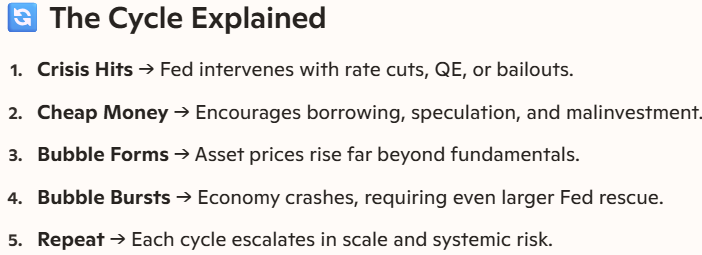
Since the late 1980s, each successive bubble has required larger interventions to stabilize markets after the inevitable collapse. The result is a dangerous progression: bigger bubbles, greater leverage, and more severe consequences when confidence finally breaks.
How Financial and Market Bubbles Form
Market bubbles tend to evolve through recognizable stages:
- Displacement – A new technology, policy shift, or economic change captures investor attention.
- Boom – Prices rise steadily as optimism grows and credit expands.
- Euphoria – Valuations detach from fundamentals; speculation replaces analysis.
- Profit-Taking – Informed participants quietly reduce exposure as volatility increases.
- Panic and Collapse – A catalyst triggers a rapid loss of confidence and forced selling.
These stages are not theoretical—they have repeated across centuries of market history.
The Big Picture
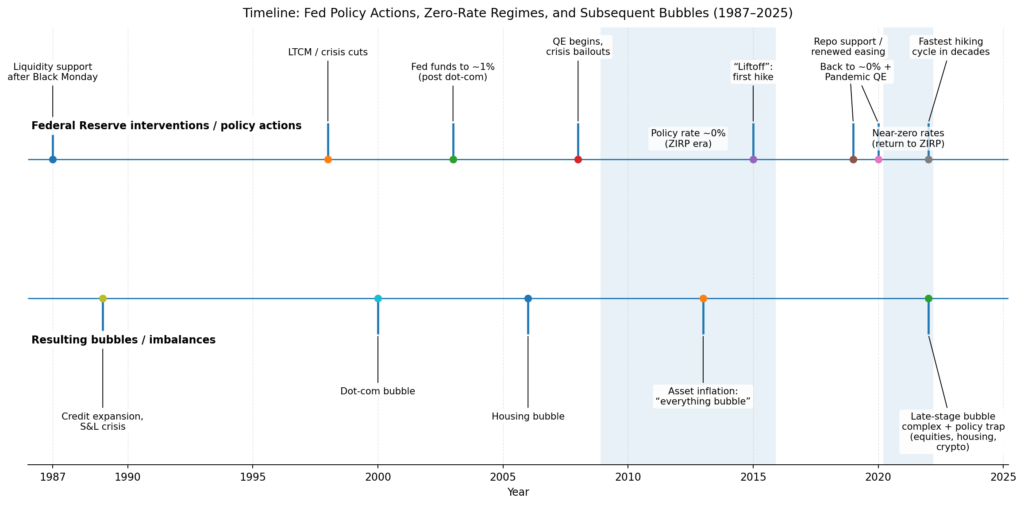
The chart below shows total debt outstanding across all sectors of the U.S. economy. It is not a measure of speculation in any single asset class, but rather the cumulative result of how credit has been priced, encouraged, and expanded over time. What stands out is not simply the level of debt, but the absence of any sustained deleveraging cycle. Each recession appears only as a pause in the upward trajectory, followed by renewed acceleration. This is not accidental. It reflects a monetary policy framework that consistently responds to economic and market stress by lowering the cost of credit and extending its availability — ensuring that excess is rarely purged, but instead rolled forward and compounded.
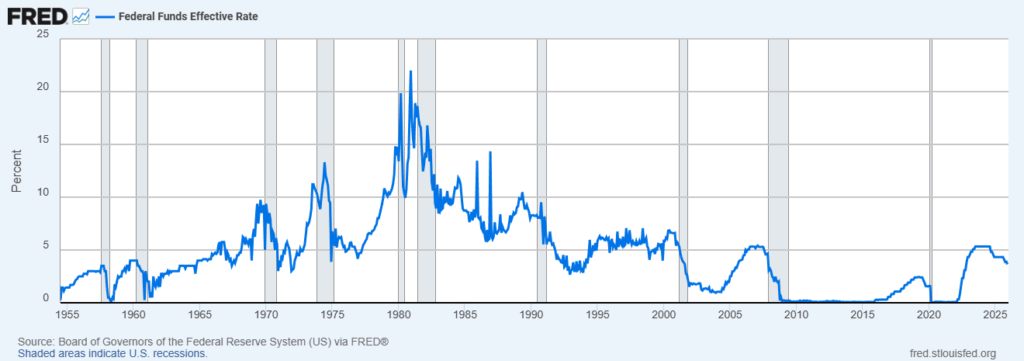
To understand why total debt has followed such an uninterrupted upward trajectory, one must examine the price of money itself. Over successive cycles, each downturn has been met with lower interest rates than the last, while periods of tightening have been shorter, shallower, and more cautious. This asymmetric policy response has trained markets and borrowers to assume that the cost of capital will ultimately be suppressed when stress emerges. The predictable result has been an ever-greater willingness to borrow, extend duration, and assume leverage — not as an exception, but as a baseline operating assumption.
Debt did not explode because borrowing became irrational; it expanded because policy made leverage the rational response.
Following the financial crisis of 2008, monetary policy evolved from managing short-term interest rates to directly intervening in credit markets through large-scale asset purchases. Quantitative easing replaced price discovery with price support, compressing risk premiums and further encouraging leverage across the system. The sharp acceleration in total debt following these interventions is not coincidental. When a central bank becomes the dominant buyer of duration and credit risk, it implicitly signals that balance sheet expansion is not merely tolerated, but protected.
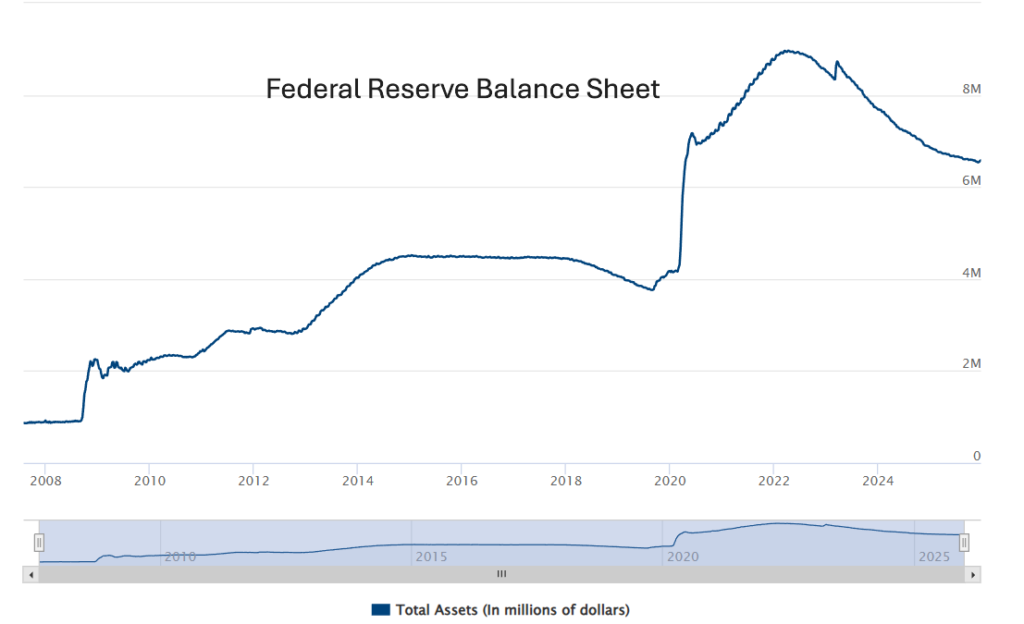
Debt itself is not inherently destructive. When used productively and allowed to contract during downturns, it can support growth. The problem arises when policy prevents meaningful deleveraging and instead incentivizes borrowing as a substitute for income growth. In such a system, stability becomes illusory — achieved not through resilience, but through ever-greater leverage. Eventually, the size of the debt overwhelms the ability of policy to manage it without causing broader dislocation.
Asset bubbles do not form in isolation. They require fuel, and that fuel is credit. While speculative excess has appeared in different sectors at different times — technology stocks in the late 1990s, housing in the mid-2000s, corporate credit and equities more recently — the common denominator has been an expanding debt base made possible by accommodative monetary policy. The Federal Reserve did not select which assets would inflate, but by repeatedly suppressing the cost of capital and intervening during downturns, it created the conditions under which leverage became the primary driver of asset prices. Over time, a series of discrete bubbles merged into a single, system-wide debt super-bubble.
Taken together, these charts tell a consistent story. The Federal Reserve did not eliminate the business cycle; it stretched it into a debt super-cycle. Each intervention reduced immediate pain but increased long-term dependence on cheap credit. The result is an economy that appears stable only so long as borrowing continues to expand — and increasingly vulnerable when it does not.
What was once a tool for stabilization has become the central organizing principle of the system.
The problem now is that so many bubbles have formed, especially after the pandemic, due to the aforementioned Fed activity plus massive fiscal stimuli, that no real option remains for a peaceful resolution to this situation. Please observe the following charts to get an idea of the scope of what has happened.
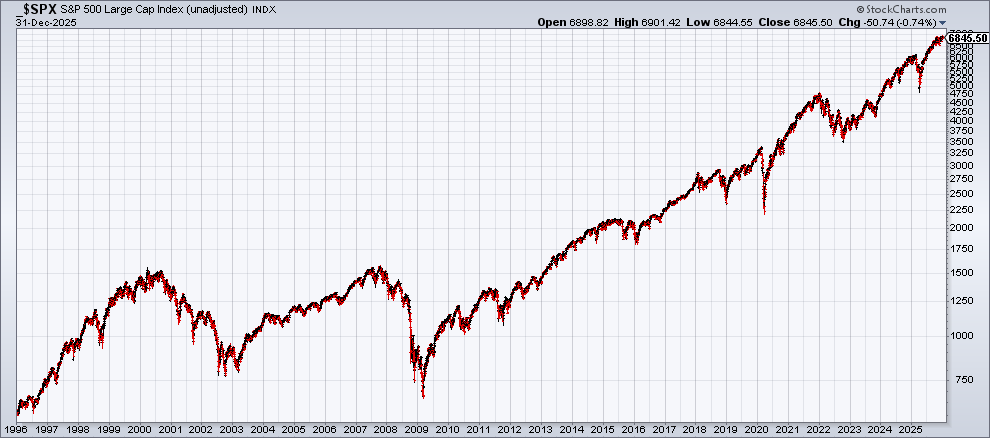
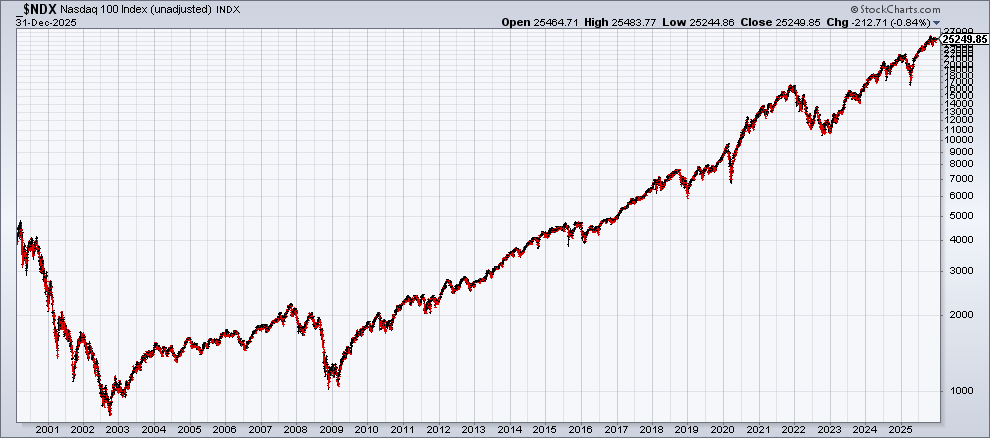
These charts are not presented to argue valuation timing in any individual market. They are included to demonstrate how broadly excess liquidity has expressed itself. When speculative excess appears simultaneously across unrelated asset classes, the common driver is not fundamentals—it is credit.
STOCKS
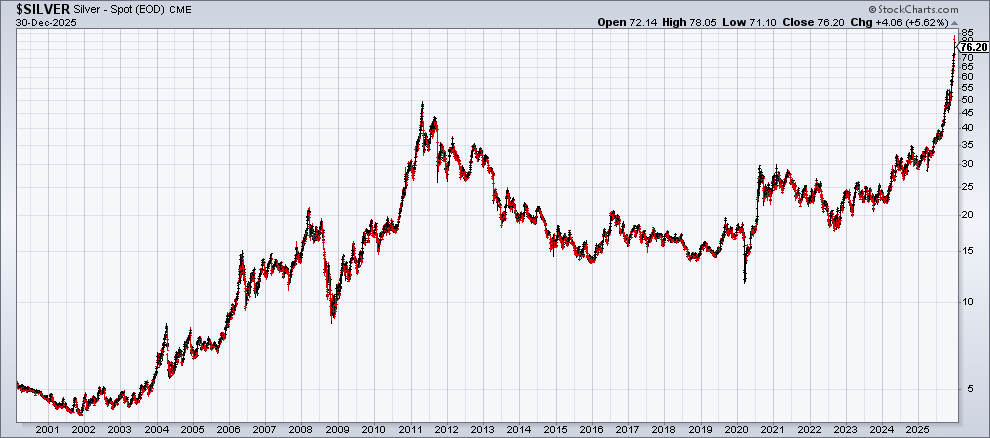
PRECIOUS METALS
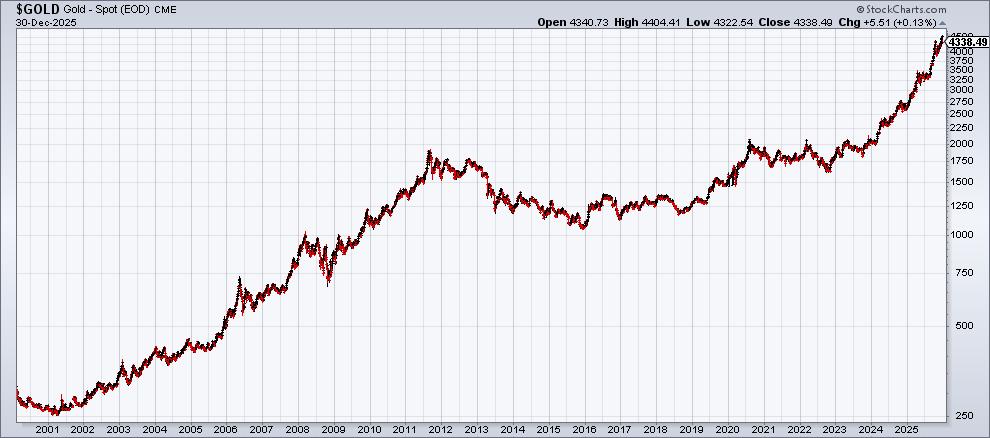
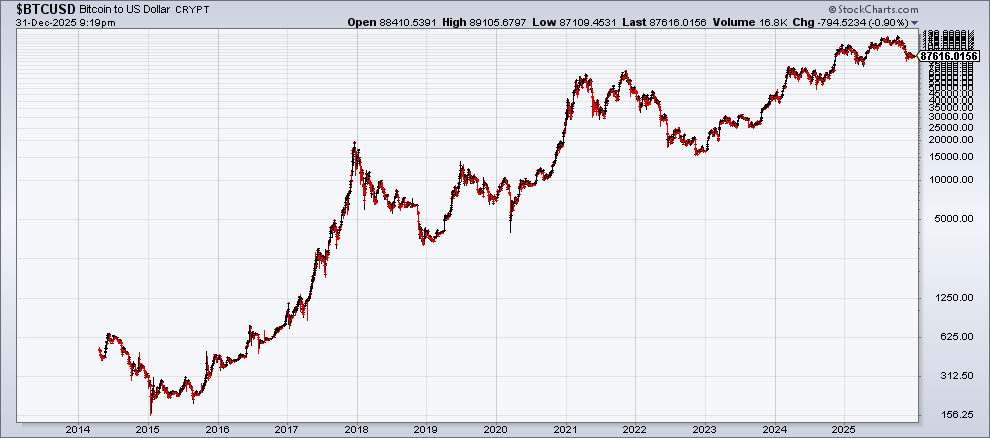
BITCOIN
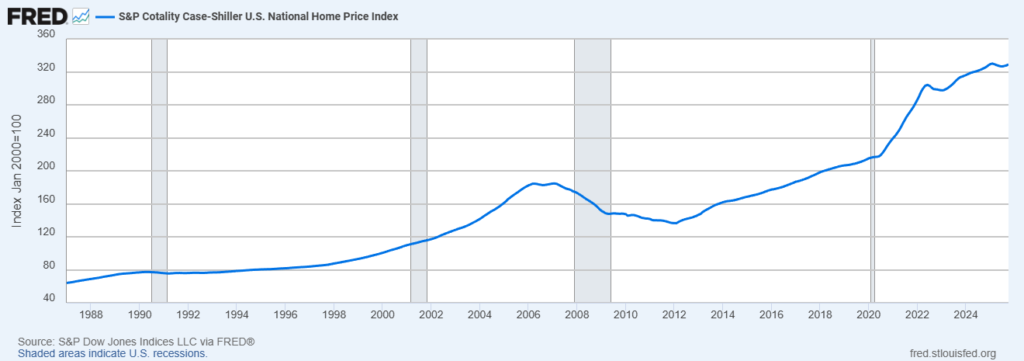
REAL ESTATE
This is no longer an abstract or academic concern. I am awaiting a final signal from the same analytical framework I have relied upon since the 1980s—a framework that warned in advance of the 1987 crash, the late-1990s equity bubble, and the housing-led crisis of the mid-2000s, and which has successfully identified numerous other major turning points in markets and the economy.
When that signal is triggered, I believe we will witness a historic unravelling of multiple, interconnected bubbles and a profound shift in attitudes toward debt, leverage, and risk itself. The longer this reckoning is delayed, the more disruptive it will ultimately become.
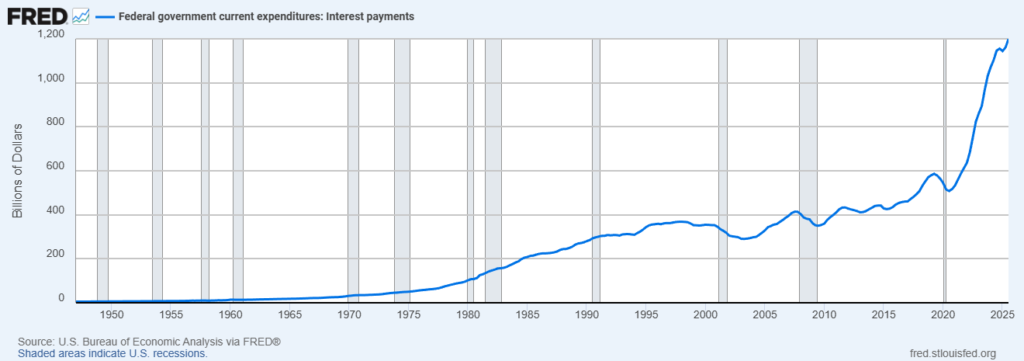
Federal interest expense is now rising faster than the economy that must support it.
The chart above is not a forecast—it is a consequence. A system dependent on ever-expanding leverage does not resolve imbalances; it merely postpones them. And as the cost of servicing that leverage rises, the margin for error collapses.
Interest costs on the federal debt now exceed one trillion dollars per year and continue to accelerate. Maintaining this structure has already required renewed liquidity and market-support operations to ensure the ongoing absorption of Treasury issuance—much of it issued simply to pay interest on existing obligations. These measures may delay the adjustment, but they do so by compounding the very forces that make the adjustment inevitable.
Those who are unprepared for what follows will be ravaged. This system, as presently constructed, is not sustainable for much longer.
I will keep you posted. Take care.
Disclaimer: The information provided is for educational purposes only and should not be construed as investment advice. Financial markets involve risk, and past performance is not indicative of future results. Readers should consult a qualified financial professional before making any investment decisions.
