
“History teaches us that we do not learn from history.”
The above quotation has been attributed to the German philosopher Hegel. I believe it is more appropriate now than the title I used in a newsletter years ago: “Whoever does not learn from history is doomed to repeat it.” This article will lay out the case that investors truly do not learn from history, even when it is directly in front of them. It is stunning how often investors repeat the same mistakes, even though the historical warnings they should be heeding are unmistakable. Today, we are at an absolute peak of indications warning of a massive change in the status quo for both the stock market and the economy. If you have been studying the markets as long as I have, these warnings are easy to see and have strong historical precedent. We will examine some of this information here.
Before I begin, I want to acknowledge my regret at not being able to transmit this information to my many thousands of former subscribers and clients around the world as I once did through my website, newsletter, voice updates, and email communications. When I shuttered my newsletter in 2015, my staff in Washington backed up the entire site and database and eventually sent me copies. I never bothered to examine them, since my IT people had always handled these tasks. Unfortunately, when I decided to reopen my newsletter in some format, I discovered I could not access the backup because it was password‑protected. During the years since 2015, any knowledge of that password has been lost, and all equipment associated with the newsletter business is gone. Even after hiring experts to break the code, it proved impossible.
Therefore, contrary to what I urgently wanted to do—namely, notify my former subscribers of an impending crash—I was not able to reach them. If you have come across this site by accident and are in that former category, I am glad you are here, and I hope this information benefits you. At present, I have decided to disseminate this information gratis. In the future, I will begin a new commercial version, but with time at a premium before the calamitous outcome I believe is imminent, it is best to get the information out now. This will definitively show that the model I have used for decades remains extremely accurate in identifying major turning points in the markets and economy, both up and down.
Official Sell Signal in the Model Confirmed This Week
While I do not divulge the exact details of the components in my proprietary model, I can tell you unequivocally that we have just seen the model issue an official signal indicating a strong likelihood of a major collapse in the stock market and a subsequent sharp decline in economic activity. Several categories are extremely important in the model, and I will display some of that information herein. The data I will be showing tells us this is almost certain to be a very powerful decline, as many indicators are at extreme levels never witnessed before.
A crash on the order of at least what happened in 2008–2009 is a very real likelihood. That said, I must also point out that never before have we witnessed such massive intervention and interference in the markets as we see today. The markets are being propped up artificially from many fronts, but I do not believe these efforts will ultimately stop the decline. Still, we must be aware of that potential.
I also want to make clear that I am not recommending anything directly. It is up to you and your advisor to decide what to do with this information, if anything, and I take no responsibility for any action anyone takes on this forecast. This is for educational purposes only and designed to inform and alert the reader to what I believe is impending danger.
Since I wanted to get this information posted quickly, I will make this piece somewhat briefer than usual. Instead of in‑depth analysis of the various data supporting the idea of a major collapse, I intend to simply display the information with minor explanation. The main point is that although a signal like this in the model is rare, the conditions in the market and economy are always present at such major turning points. As the title suggests, most investors never learn from history, always telling themselves “this time is different.” It isn’t.
Interest Rates
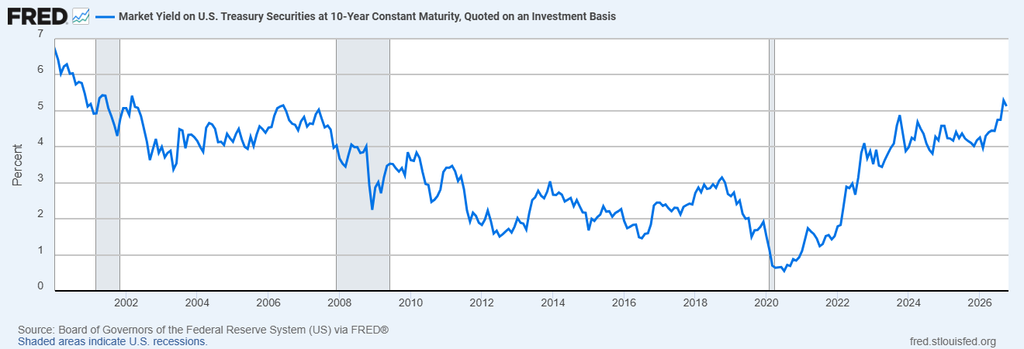
Interest rates are extremely important to the market and the economy. They are a major component in the model, with several varieties included. Although I do not use the following rate as depicted in the graph below, it is still very important. (I do not use this particular issue because it is often used as a “flight to safety,” which can distort the actual level.)
The 10‑Year Treasury Note has recently risen to multi‑year highs (March 2002), as you can see. This issue is closely tied to fixed‑rate mortgages and therefore has a profound effect on housing, especially when there is a sharp move. Historically, spikes in this rate have been followed by negative outcomes for both the market and the economy.
There are many factors influencing this rate—inflation expectations, excess supply concerns, fiscal activity, and outstanding debt. I will not go into detail here, as I have covered these topics in other articles on this site. Suffice it to say, there are major problems for U.S. debt at present.
Inflation
Inflation can be confusing unless you have spent considerable time analyzing the various measurements. There are consumer price levels (with and without food and energy), wholesale prices, and the Personal Consumption Expenditure index—the Fed’s preferred measure. To be frank, most of these are used to distort the actual level of inflation so politicians and the Fed are not accused of failing at their jobs. Most indices floated to the public are grossly understated.
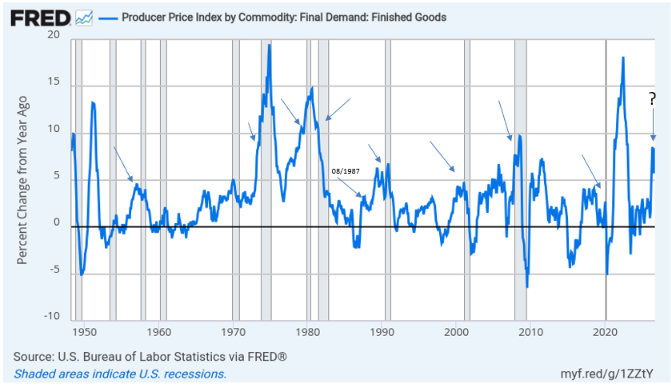
However, I have found one measure of inflation that is of utmost importance: the Producer Price Index for Finished Goods. This index depicts prices at the wholesale level just prior to distribution to retail. It gives us a very real clue as to what consumer inflation will do in six months or so.
As indicated in the data below, almost every major spike in this reading has resulted in a recession. Whenever the year‑over‑year percentage change exceeds 5%, real problems usually arise. Right now, as of the September data, this level is above 8%. This is telling us that extreme danger is present. I have also noted another time where this data spiked sharply—August 1987—just before the biggest stock crash in history.
Major Bubbles Are Beginning to Burst
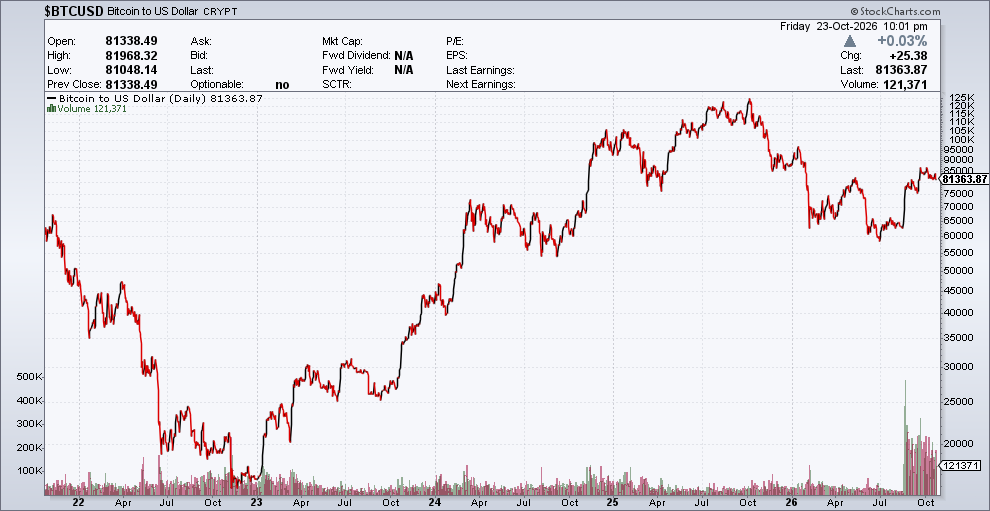
Bitcoin, which I discussed in my article Federal Reserve Interventions as part of the “bubble everywhere” scenario, is clearly showing signs of a bubble bursting. From a high of around $125,000, it currently sits near $81,000—a decline of about 35%. The shape of the chart is not encouraging; it looks like a major top has been reached, forecasting lower prices ahead. This makes perfect sense as liquidity is being drained out of most bubbles due to massive debt everywhere and higher interest rates.
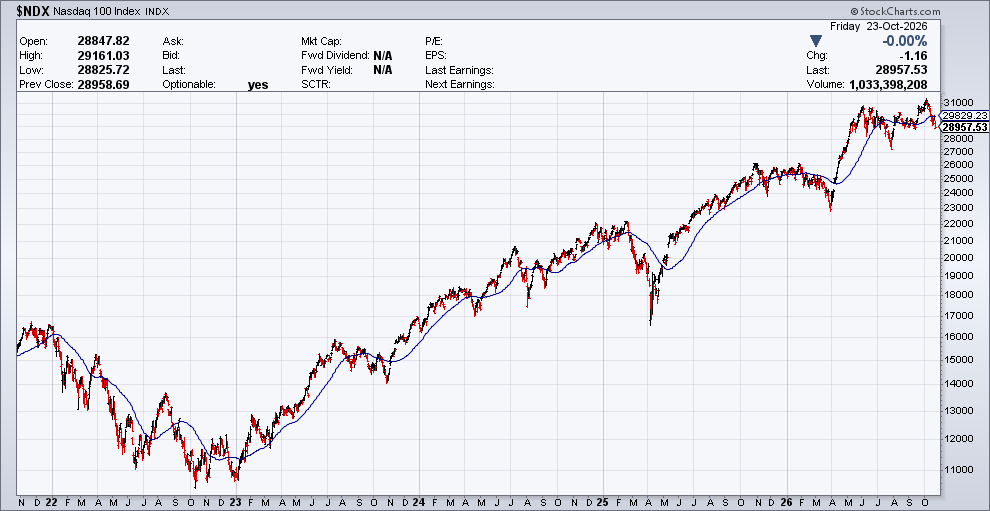
The NASDAQ 100 has substantially breached its 50‑day moving average, which is important. This could portend lower prices ahead, and I certainly expect that. The index has been bolstered by a relatively few stocks, making it appear stronger than it is. With so much focus on AI among the titans of this index, I believe this bubble is close to bursting as well. I am not talking about the long‑term future of AI, but rather the massive amount of debt and speculation focused in that area. These overestimations of short‑term returns almost always end badly.
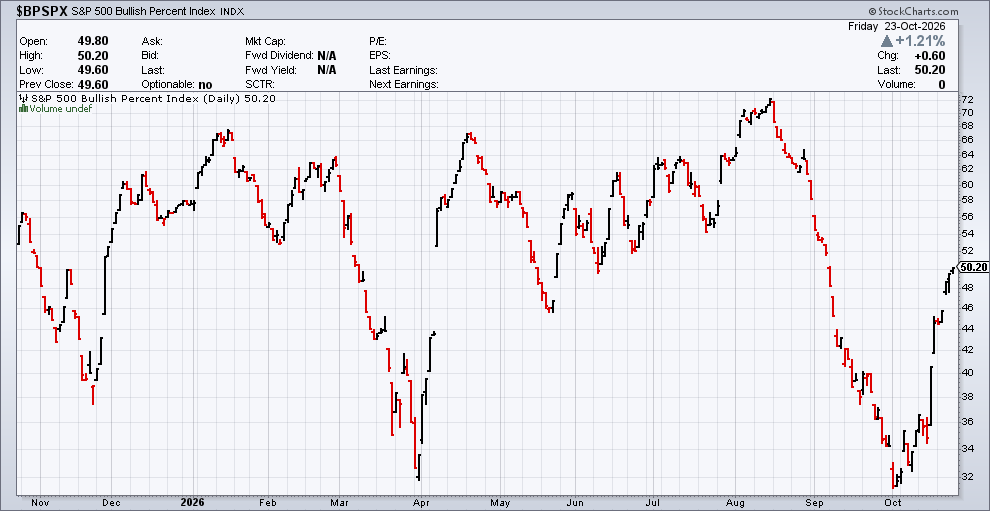
The bullish percentage index of the S&P 500 shows that half of its constituents are trading below their 200‑day moving average—technically very weak. Again, relatively few stocks are making the indices appear healthy when they are, in fact, lopsided and dangerous.
One other technical indicator I use is the Hindenburg Omen. There are currently three confirmed Omens in place. While not a pure timing tool, it depicts the general health of the market. With this number of Omens, the environment is dangerous, with a 30% chance of a major decline. This confirms that the current environment is ripe for a significant downturn.
Debt
There is a lot of information in the aforementioned article Federal Reserve Interventions, as well as in other articles on this site, so I will not go into great detail about the scope and risk of the massive debt in existence. Since that article was published, huge amounts of new debt have been added across the spectrum, intensifying the impact of rising interest rates. We are already seeing signs of increasing risk in many corporate debt areas, demonstrating that borrowing has gotten out of hand.
Even the 10‑Year Note has added pain to the investment world because as interest rates rise, the price of the underlying bond declines. Some large banks and hedge funds holding huge amounts of these instruments have seen unrealized losses in the tens of billions. This impacts their balance sheets and creates potential regulatory issues. That is exactly what happened in 2022 when several Silicon Valley banks collapsed under the weight of these holdings as rates rose rapidly.
However, here I am going to discuss only one area of debt that is troubling and which I did not discuss in previous posts.
The AI Leverage Problem
While debt is exploding across the entire financial landscape, one area deserves special attention: the extraordinary leverage behind the AI boom. Investors have poured money into AI‑related stocks under the assumption that near‑term returns will justify the hype. But beneath the surface, the entire AI ecosystem is being financed by one of the largest and most opaque debt expansions in modern corporate history.
Funded AI‑related debt has surged to an estimated $400–$600 billion, with projections of $570 billion in new issuance for 2026 alone. Hyperscalers—once known for enormous cash reserves—have become the most aggressive borrowers in the world. Their bond issuance jumped from $20 billion in 2024 to $109 billion in 2025, and then to $152 billion in the first five months of 2026, with expectations of $300 billion by year‑end.
But the most troubling part is not the disclosed debt—it is the hidden liabilities.
Major tech firms have issued over $300 billion in guarantees backing data‑center construction and chip procurement. Moody’s reports $662 billion in future data‑center lease obligations for Amazon, Meta, Alphabet, Microsoft, and Oracle—equal to 113% of their combined adjusted debt. Across seven leading tech companies, there are $3.1 trillion in off‑balance‑sheet commitments, including long‑term purchase agreements and financial guarantees.
Private‑credit structures and SPVs obscure even more risk. One example is a $35 billion private‑credit facility supporting Anthropic that never appears on its balance sheet. These arrangements shift liabilities to intermediaries while tech firms quietly backstop the exposure—eerily similar to the shadow‑banking dynamics that preceded the 2008 crisis.
We are already seeing early signs of stress. CoreWeave’s credit default swaps surged above 1,000 basis points, signaling severe default risk. Its bond yields approached 15%, triggering a sector‑wide selloff. Semiconductor stocks fell for eight straight sessions, and Nvidia lost $270 billion in market cap in one week as investors reassessed AI‑driven demand. Credit spreads widened for Oracle and SoftBank as well.
When you combine funded debt, guarantees, leases, and off‑balance‑sheet commitments, the conservative estimate of total AI‑linked liabilities reaches $4–5 trillion. Not all of this is formal debt, but all of it must be serviced. And as interest rates rise, the cost of carrying this leverage becomes increasingly painful.
This is why I believe the AI bubble is close to bursting. The long‑term future of AI may be bright, but the short‑term expectations have been wildly overestimated, and the debt used to fuel the frenzy is now colliding with rising rates, tightening liquidity, and deteriorating credit conditions. History shows that when speculation is financed by massive leverage, the outcome is almost always the same.
I will keep you posted. Take care and good luck,
Disclaimer: The information provided is for educational purposes only and should not be construed as investment advice. Financial markets involve risk, and past performance is not indicative of future results. Readers should consult a qualified financial professional before making any investment decisions.
