
Major Market Turning Points — The Shepherd Model’s Historical Record
For more than four decades, I have used a proprietary econometric model to analyze financial markets and identify significant changes in market direction. Originally developed in the 1980s, the model became the foundation of my investment management and advisory work and, subsequently, The Shepherd Investment Strategist, my investment newsletter distributed to thousands of subscribers worldwide.
While the model has generated numerous buy and sell signals over the years, this historical review concentrates on its warnings surrounding major market turning points—periods when excessive speculation, financial imbalances, and changing economic conditions created extraordinary risks and opportunities for investors.
The examples presented here include the October 1987 stock market crash, the technology bubble of 1999–2000, the housing and financial crisis of 2007–2009, and the model’s most recent major sell signal, confirmed on October 20, 2026.
Where available, I have included excerpts from my original newsletters and publications so readers can examine the warnings issued at the time, rather than relying solely on retrospective accounts.
These examples represent selected major market events, not a complete record of the model’s historical signals. No forecasting method is infallible, and past performance does not guarantee future results.
1987 — Anticipating the Black Monday Crash
In September 1987, my proprietary market model generated a major sell signal, warning of serious danger in the stock market several weeks before the historic October 19 collapse. The warning was sufficiently early to allow us to establish options positions designed to benefit from a substantial market decline. When Black Monday arrived, the Dow Jones Industrial Average plunged 22.6% in a single session, and options originally purchased for a few hundred dollars each were liquidated for approximately $30,000 per contract.
This experience demonstrated the potential importance of identifying major market turning points before the full consequences become apparent. It also reinforced a principle that has guided my investment work throughout the ensuing decades: recognizing periods of exceptional market risk can be just as important as identifying opportunities for appreciation.
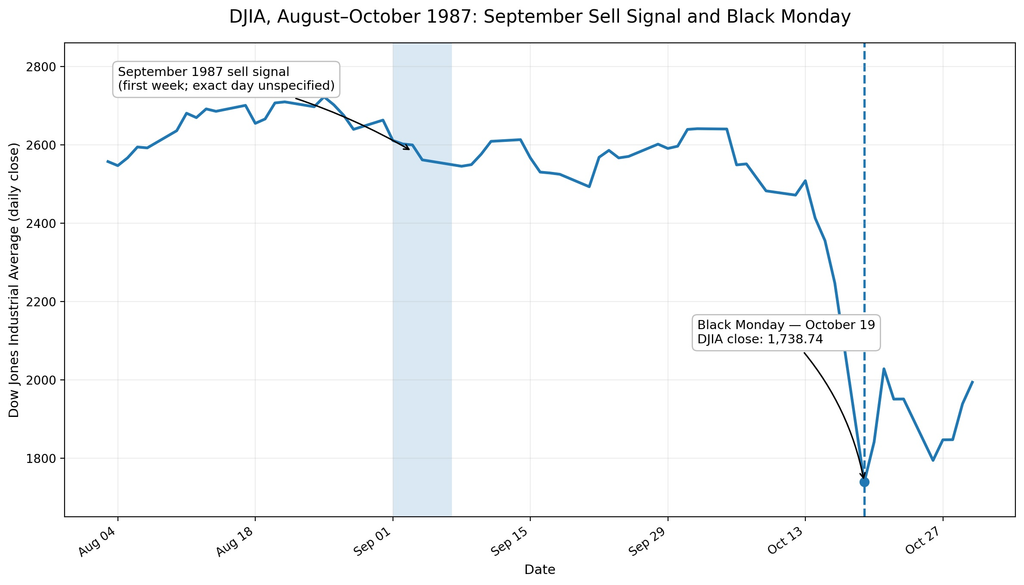
For additional background on my experience during the 1987 stock market crash and the development of my market model, see my article, Fix It ‘Til It’s Broken, originally published October 6, 2025.
1999–2000 — Anticipating the Technology Bubble Collapse
During the late 1990s, extraordinary speculation in technology and internet-related stocks drove market valuations to historically excessive levels. Investors increasingly abandoned traditional valuation measures, convinced that the emergence of the internet had fundamentally changed the rules governing financial markets.
My proprietary model began identifying serious market vulnerabilities during this period, generating a sell signal on October 25, 1999. Subsequent newsletters documented the continued deterioration of market conditions and the development of increasingly dangerous technical and economic signals.
An important factor influencing the market during this period was the Federal Reserve’s extraordinary liquidity intervention in preparation for the potential disruptions associated with Y2K. Beginning in the fall of 1999, the Fed provided tens of billions of dollars in additional liquidity through repurchase agreements and other measures designed to stabilize financial markets during the transition to the year 2000.
I believe these operations helped sustain the market’s advance after my model had already issued its warning, providing additional support to speculative activity, particularly in technology shares. The Dow Jones Industrial Average eventually reached its major peak in January 2000, while the Nasdaq continued advancing until March. The subsequent collapse demonstrated that additional liquidity could postpone a market reversal without necessarily eliminating the underlying speculative excesses.
The Dow Jones Industrial Average, the primary market index underlying my proprietary model, reached its major closing peak on January 14, 2000, less than three months after the October 25, 1999 sell signal. The Dow subsequently declined approximately 38% before reaching its October 2002 bear-market low. Meanwhile, the technology-heavy Nasdaq Composite continued its speculative advance until March 2000, before experiencing an even more dramatic collapse.
These developments demonstrated how speculative enthusiasm and extraordinary liquidity conditions could temporarily sustain market advances despite increasingly dangerous underlying financial conditions.
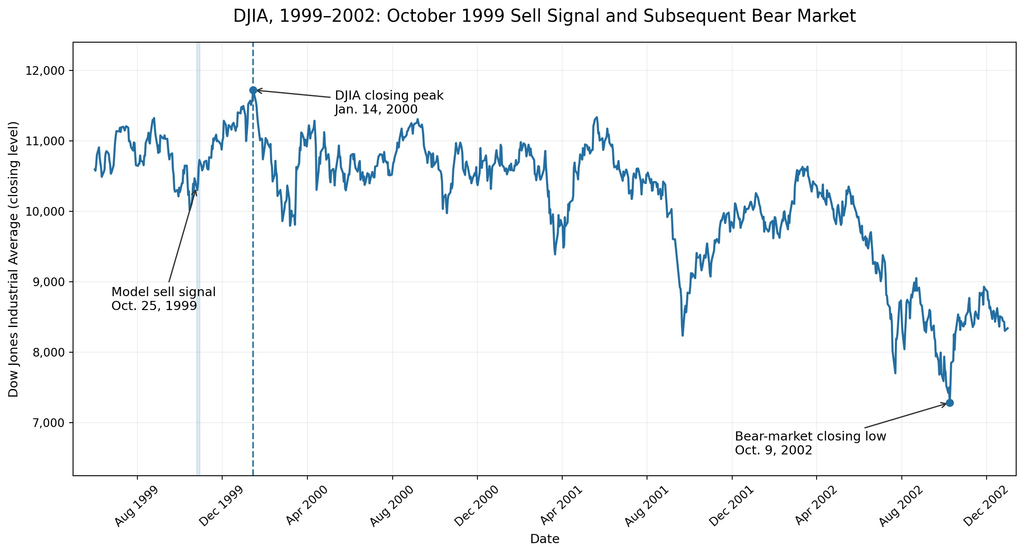
Of particular importance is that my original newsletters from 1999 and 2000 documented these warnings as events were unfolding. They provide readers with an opportunity to examine what the model was indicating at the time, rather than relying on predictions reconstructed after the fact.
For a more detailed account, including excerpts from my original newsletters published during 1999 and 2000, see Tech Bubble Burst 2000 — How the Model Exited Before the Collapse. These contemporaneous publications document the model’s warnings and my analysis as the speculative technology bubble developed and ultimately collapsed.
2005–2009 — Anticipating the Housing and Financial Crisis
Beginning in 2005, I repeatedly warned subscribers to The Shepherd Investment Strategist about the rapidly expanding housing bubble, excessive mortgage lending, and the increasing dependence of the American economy on debt-financed consumption.
My newsletters during 2005–2007 discussed the dangers posed by subprime mortgages, deteriorating lending standards, mortgage-backed securities, and the potential consequences of a major reversal in housing prices. These concerns were documented well before the financial crisis reached its most destructive stage.
Importantly, my subscribers and investment management clients had already been advised to exit their stock market positions by early 2008, well before the model generated its major crash warning in September. Based on the deteriorating financial conditions I had been discussing in my newsletters for several years, I had concluded that the risks of remaining invested in equities were simply too great. Consequently, those who followed this guidance were positioned to avoid the substantial stock market losses that occurred during the early stages of the financial crisis.
The September 2008 major sell signal represented a further development. By then, we were no longer simply concerned with preserving capital. The model’s exceptionally severe warning provided an opportunity to establish positions designed to profit from the accelerating market collapse.
In September 2008, my proprietary market model generated a major sell signal comparable in magnitude to the warning it had issued in September 1987. This signal reinforced my assessment that financial conditions had become exceptionally dangerous. Options positions established to benefit from the accelerating market decline subsequently generated substantial profits.
The financial crisis ultimately produced one of the most severe bear markets in modern history. From its October 2007 peak to its March 2009 low, the S&P 500 declined approximately 57%, while the U.S. economy experienced its deepest recession since the Great Depression.
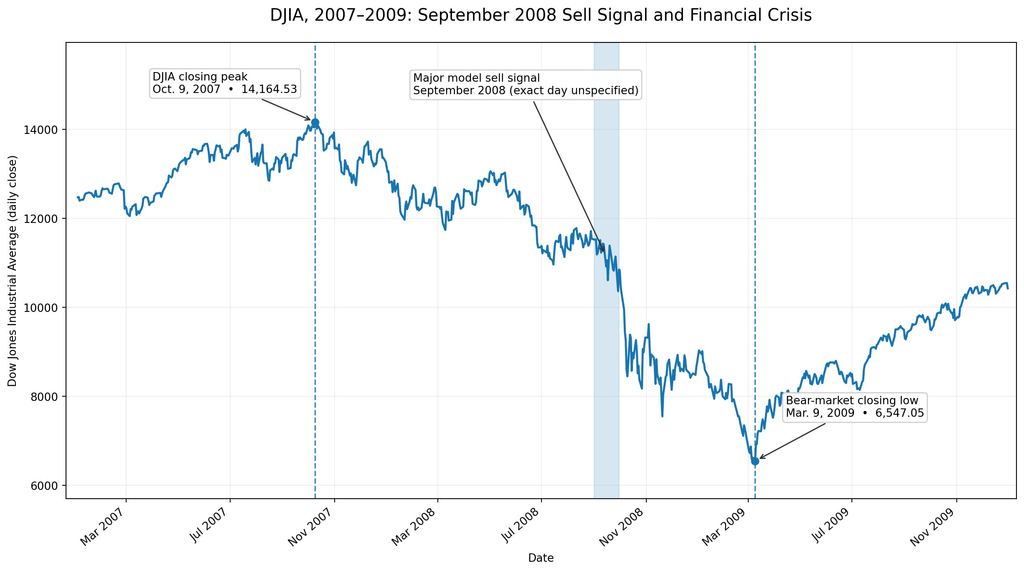
These original publications illustrate the importance of recognizing systemic financial imbalances before their consequences become widely apparent. They also demonstrate the distinction between identifying dangerous economic conditions well in advance and receiving a specific model signal indicating that market risks have intensified dramatically.
For documentation of these earlier warnings, including excerpts from my original newsletters published between 2005 and 2007, see Warnings Before the Financial Crisis (2005–2007). These contemporaneous publications describe the growing housing bubble, excessive debt, and the risks developing throughout the financial system.
2026 — A New Major Sell Signal and the AI Bubble
On October 20, 2026, my proprietary econometric model generated an official sell signal of the same magnitude as those issued in September 1987 and September 2008. This was an exceptionally serious warning, indicating what I believe to be a high probability of a major stock market decline, potentially followed by a significant contraction in economic activity.
The signal came amid extraordinary levels of speculation, excessive debt, rising financing burdens, and unprecedented financial commitments to artificial intelligence infrastructure. Although the long-term technological potential of AI may be substantial, I believe investors have dramatically overestimated the near-term financial returns while underestimating the risks associated with financing its expansion.
In my article announcing the signal, I discussed several indicators reinforcing the model’s warning, including elevated interest rates, inflationary pressures, deteriorating market breadth, weakness in technology stocks, and the enormous debt and contractual obligations supporting AI-related investments.
Subsequent market activity has shown considerable weakness in technology and AI-related stocks, accompanied by growing investor concerns about capital expenditures, debt financing, and the sustainability of projected returns. These developments have been consistent with important elements of the original warning.
However, the ultimate outcome of this forecast remains undetermined. The model’s signal indicates the potential for a much larger market decline, and only subsequent market and economic developments will establish the accuracy and significance of that prediction.
For the complete analysis and original announcement of this major sell signal, see my October 2026 article on the historical market warnings, deteriorating financial conditions, and extraordinary risks associated with the AI investment boom. This contemporaneous forecast provides a permanent record of the model’s warning and the supporting analysis as published at the time.